
Austin Real Estate Market Report
Travis County Report
Double Digit Price Increases Reflected in Closed Sales
Austin has been in a new listing deficit for quite some time, with the number of new listings each month falling short of the number of pending sales. Every month we report that the housing inventory is shrinking which puts upward pressure on pricing.
Now we have evidence that the pace of price appreciation began accelerating a couple of months ago and is firmly in place to continue. The average price of July’s closed sales was $580,095, a huge 17.4% year-over-year increase as compared to the same time last year. There’s more. The median price was $435,000 and the average price per square foot was $248, which are year-over-year increases of 12.2% and 13.3%, respectively.
To put these figures into perspective, from January to June, 2020’s average monthly sale prices were ranging between 4% and 9% higher than 2019 sale prices from the same time period.
Preliminary data from August indicates that the double-digit price increases will continue, and likely accelerate, as we move into the fourth quarter. Clearly, in spite of potential short-term fluctuations due to COVID-19, mid- and long-term forecasts for strong demand, limited housing supply and price appreciation remain intact.
Demand – Pending Sales
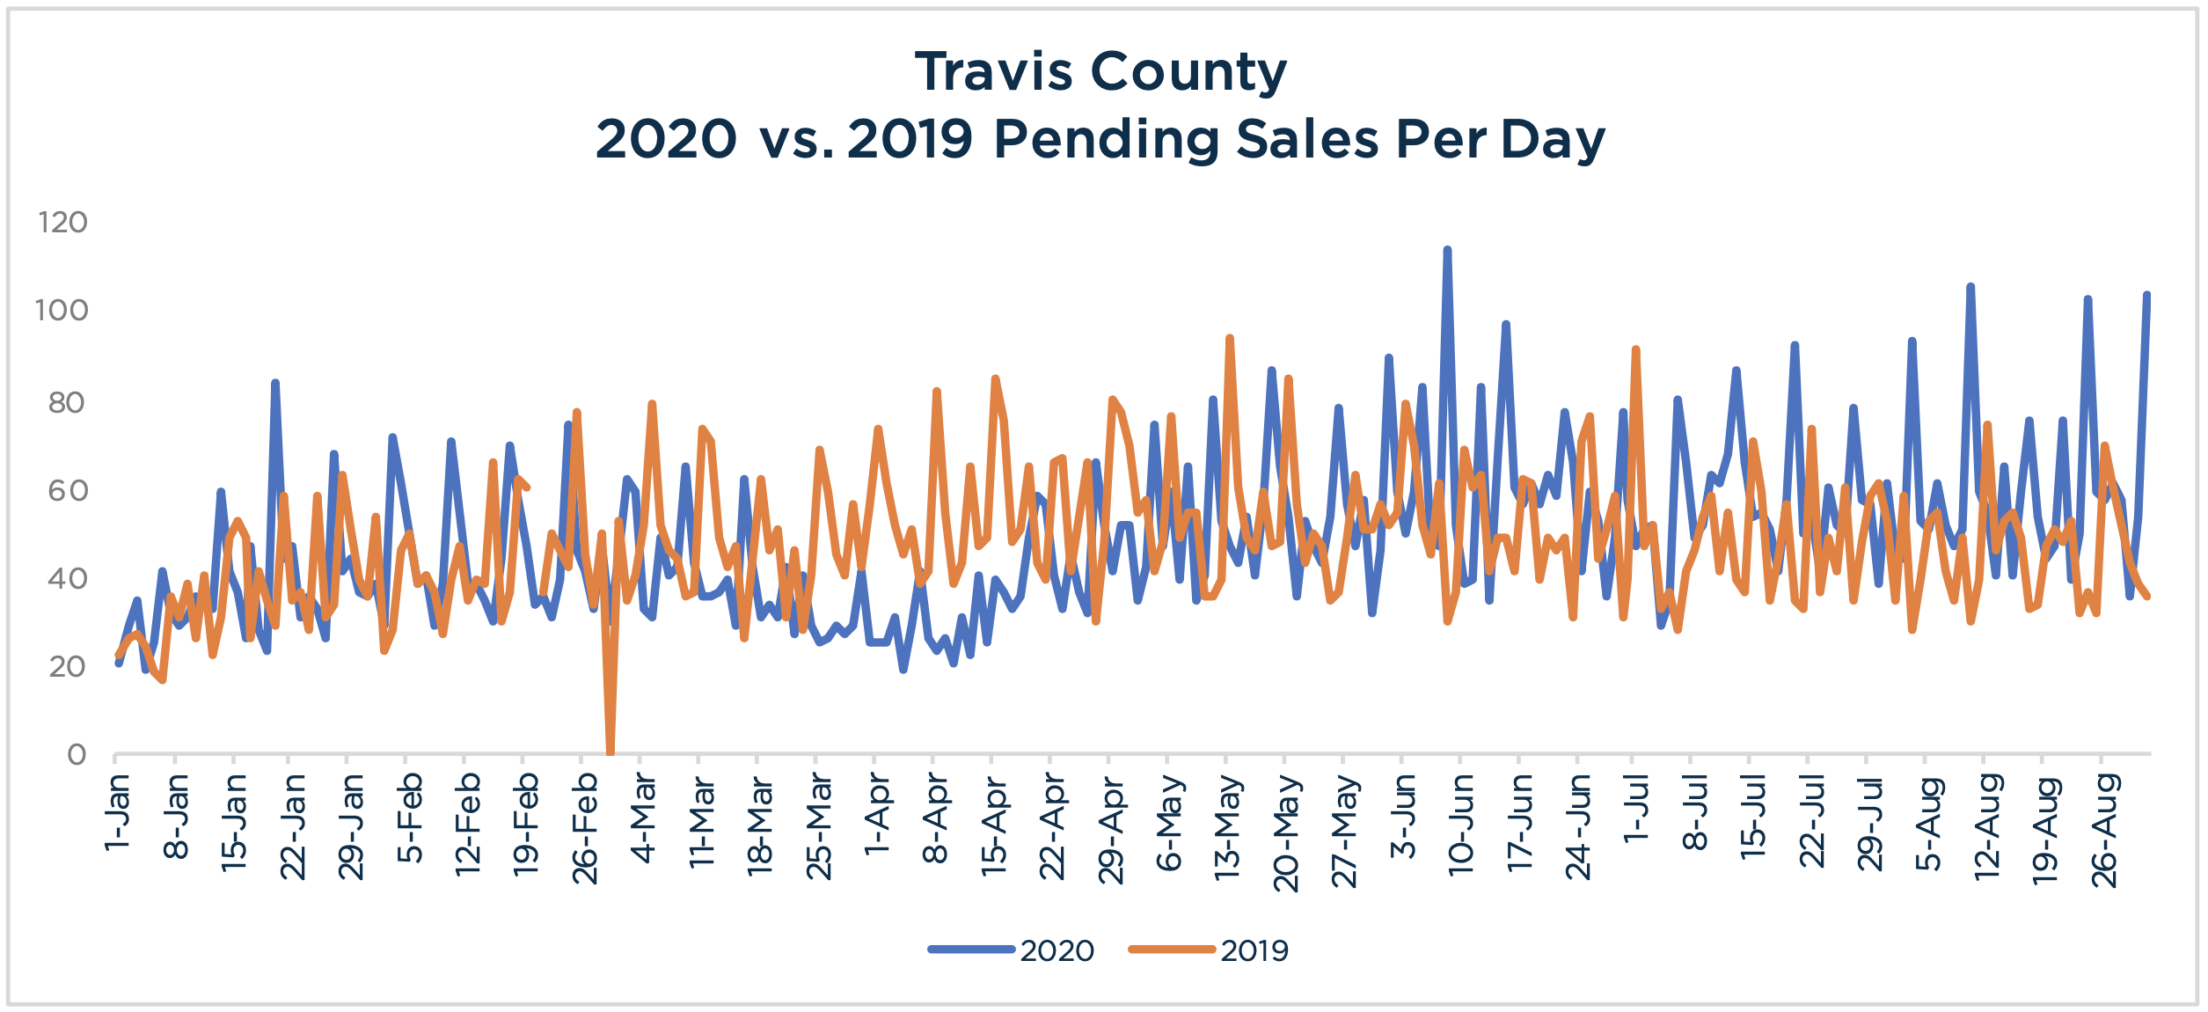
Pending sales in August continued to show an increasingly strong turnaround in effective demand that began in May after bottoming out in April and March, due to COVID-19.
August figures were up 24.5% year-over-year as compared to the same time last year, measurably higher than the 16% and 20.4%, year-over-year increases in July and June, respectively.
The pace of pending sales over the last 7 days of August was up 25.2% as compared to last year at the same time, reinforcing the array of other indications that demand continues to gain momentum, which increases upward pressure on pricing.
Overall, pending sales are down .6% year-to-date as compared to 2019, as the strong demand in the last few months almost completely offset the downward impact of April and May’s low figures due to COVID-19.
Source: Austin Board of Realtors Travis County, as of September 2nd, 2020, for New and Existing Single Family Homes. Figures are preliminary and subject to revision based on ABoR’s upcoming report for August.
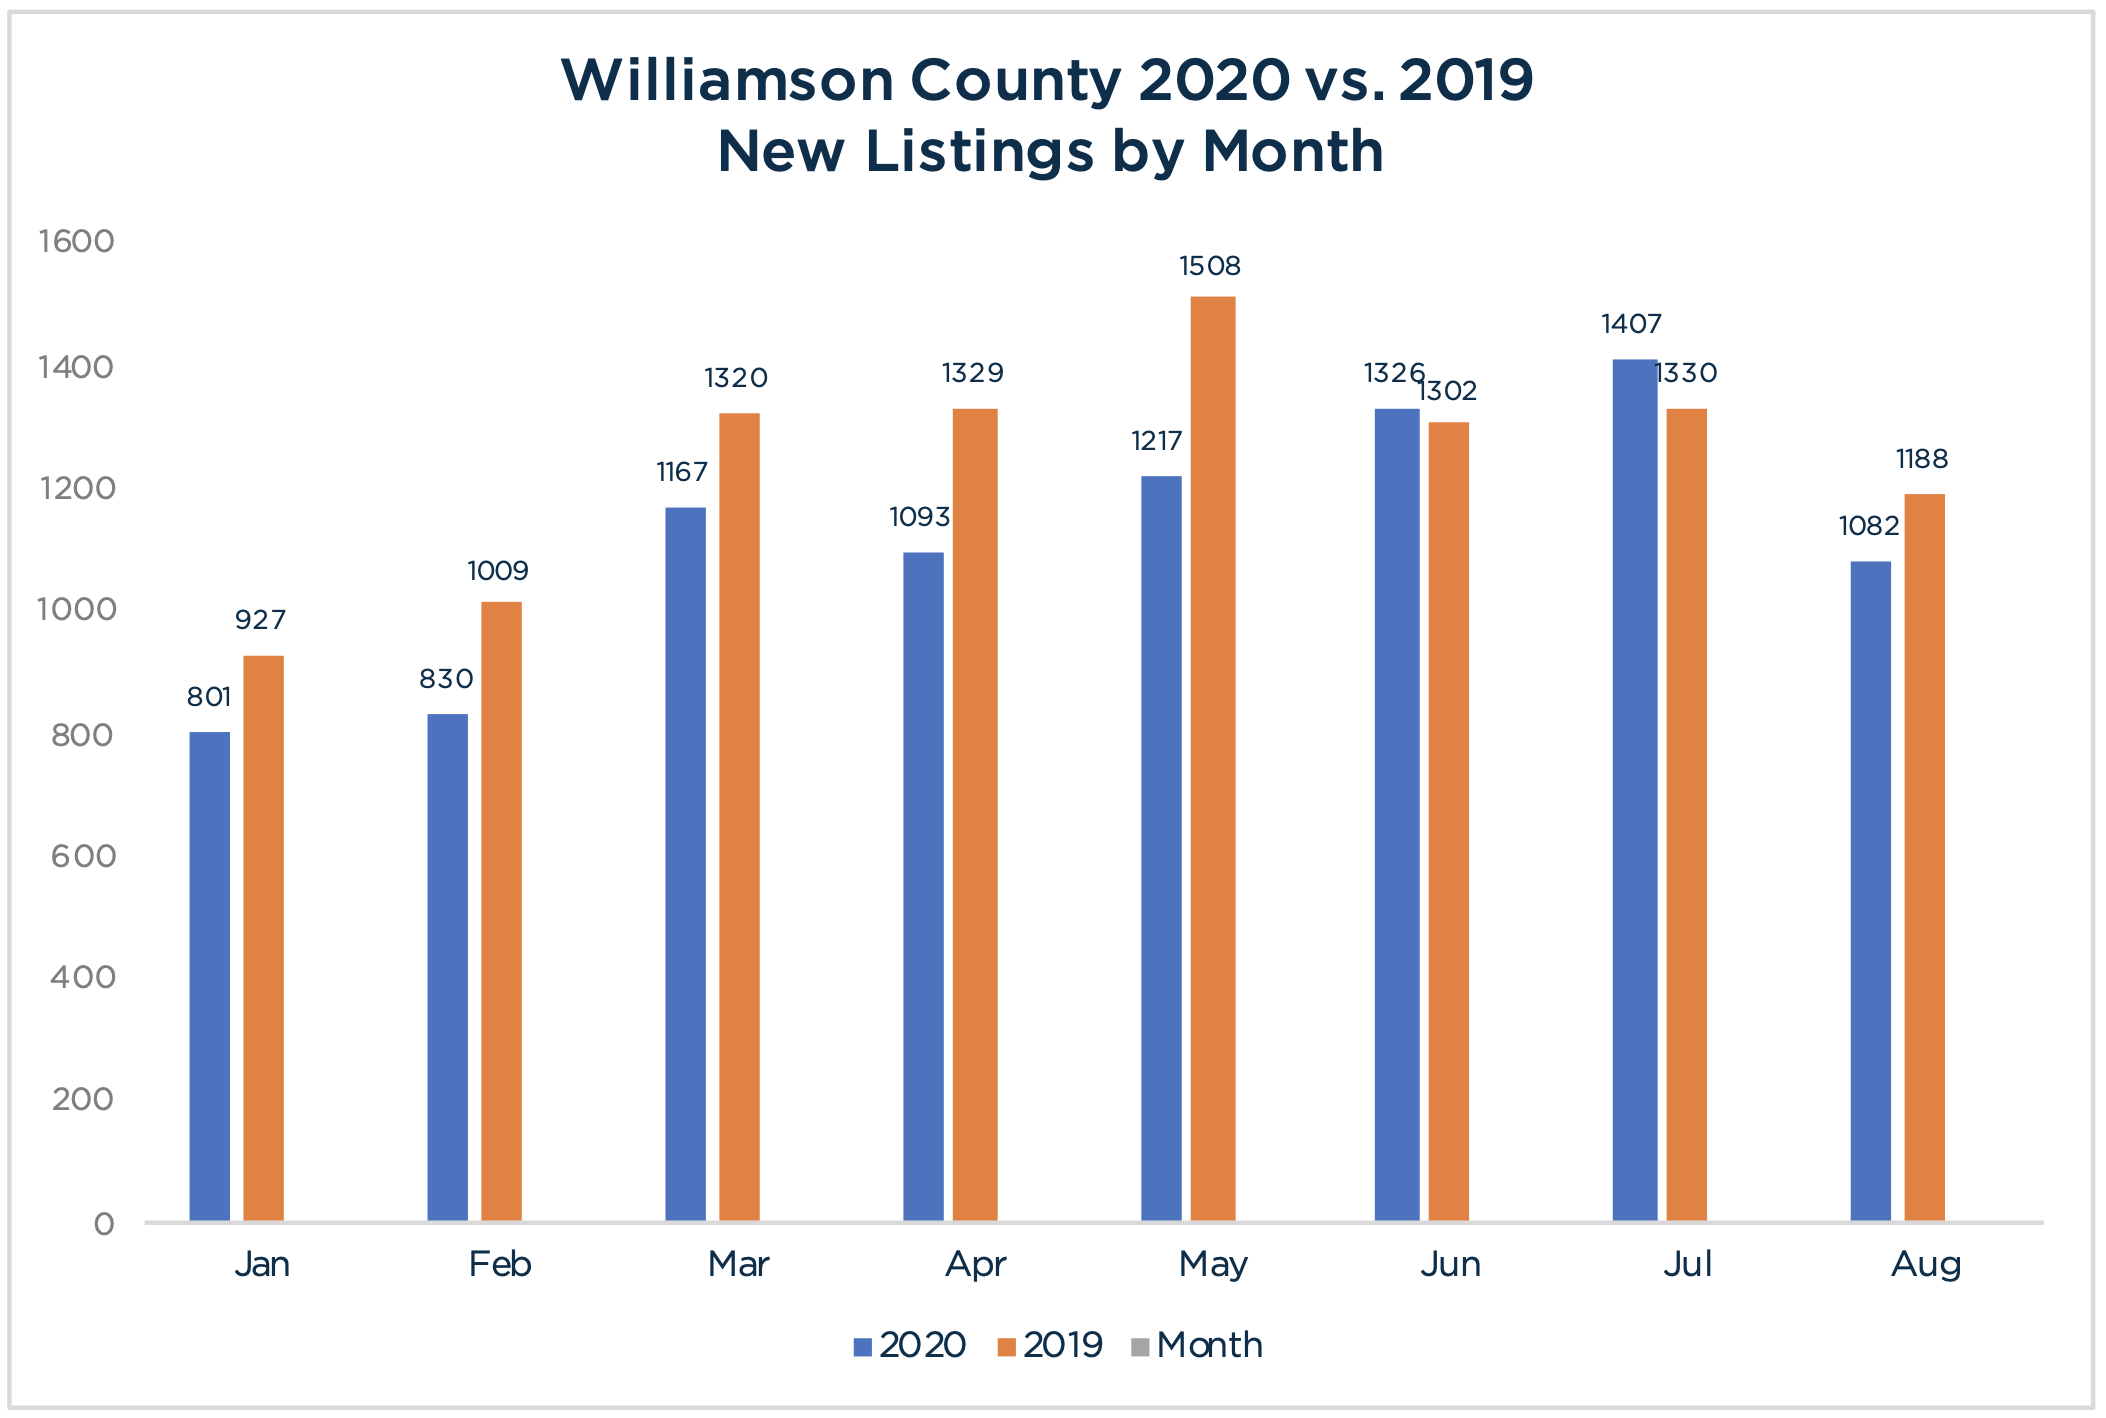
Supply – New Listings
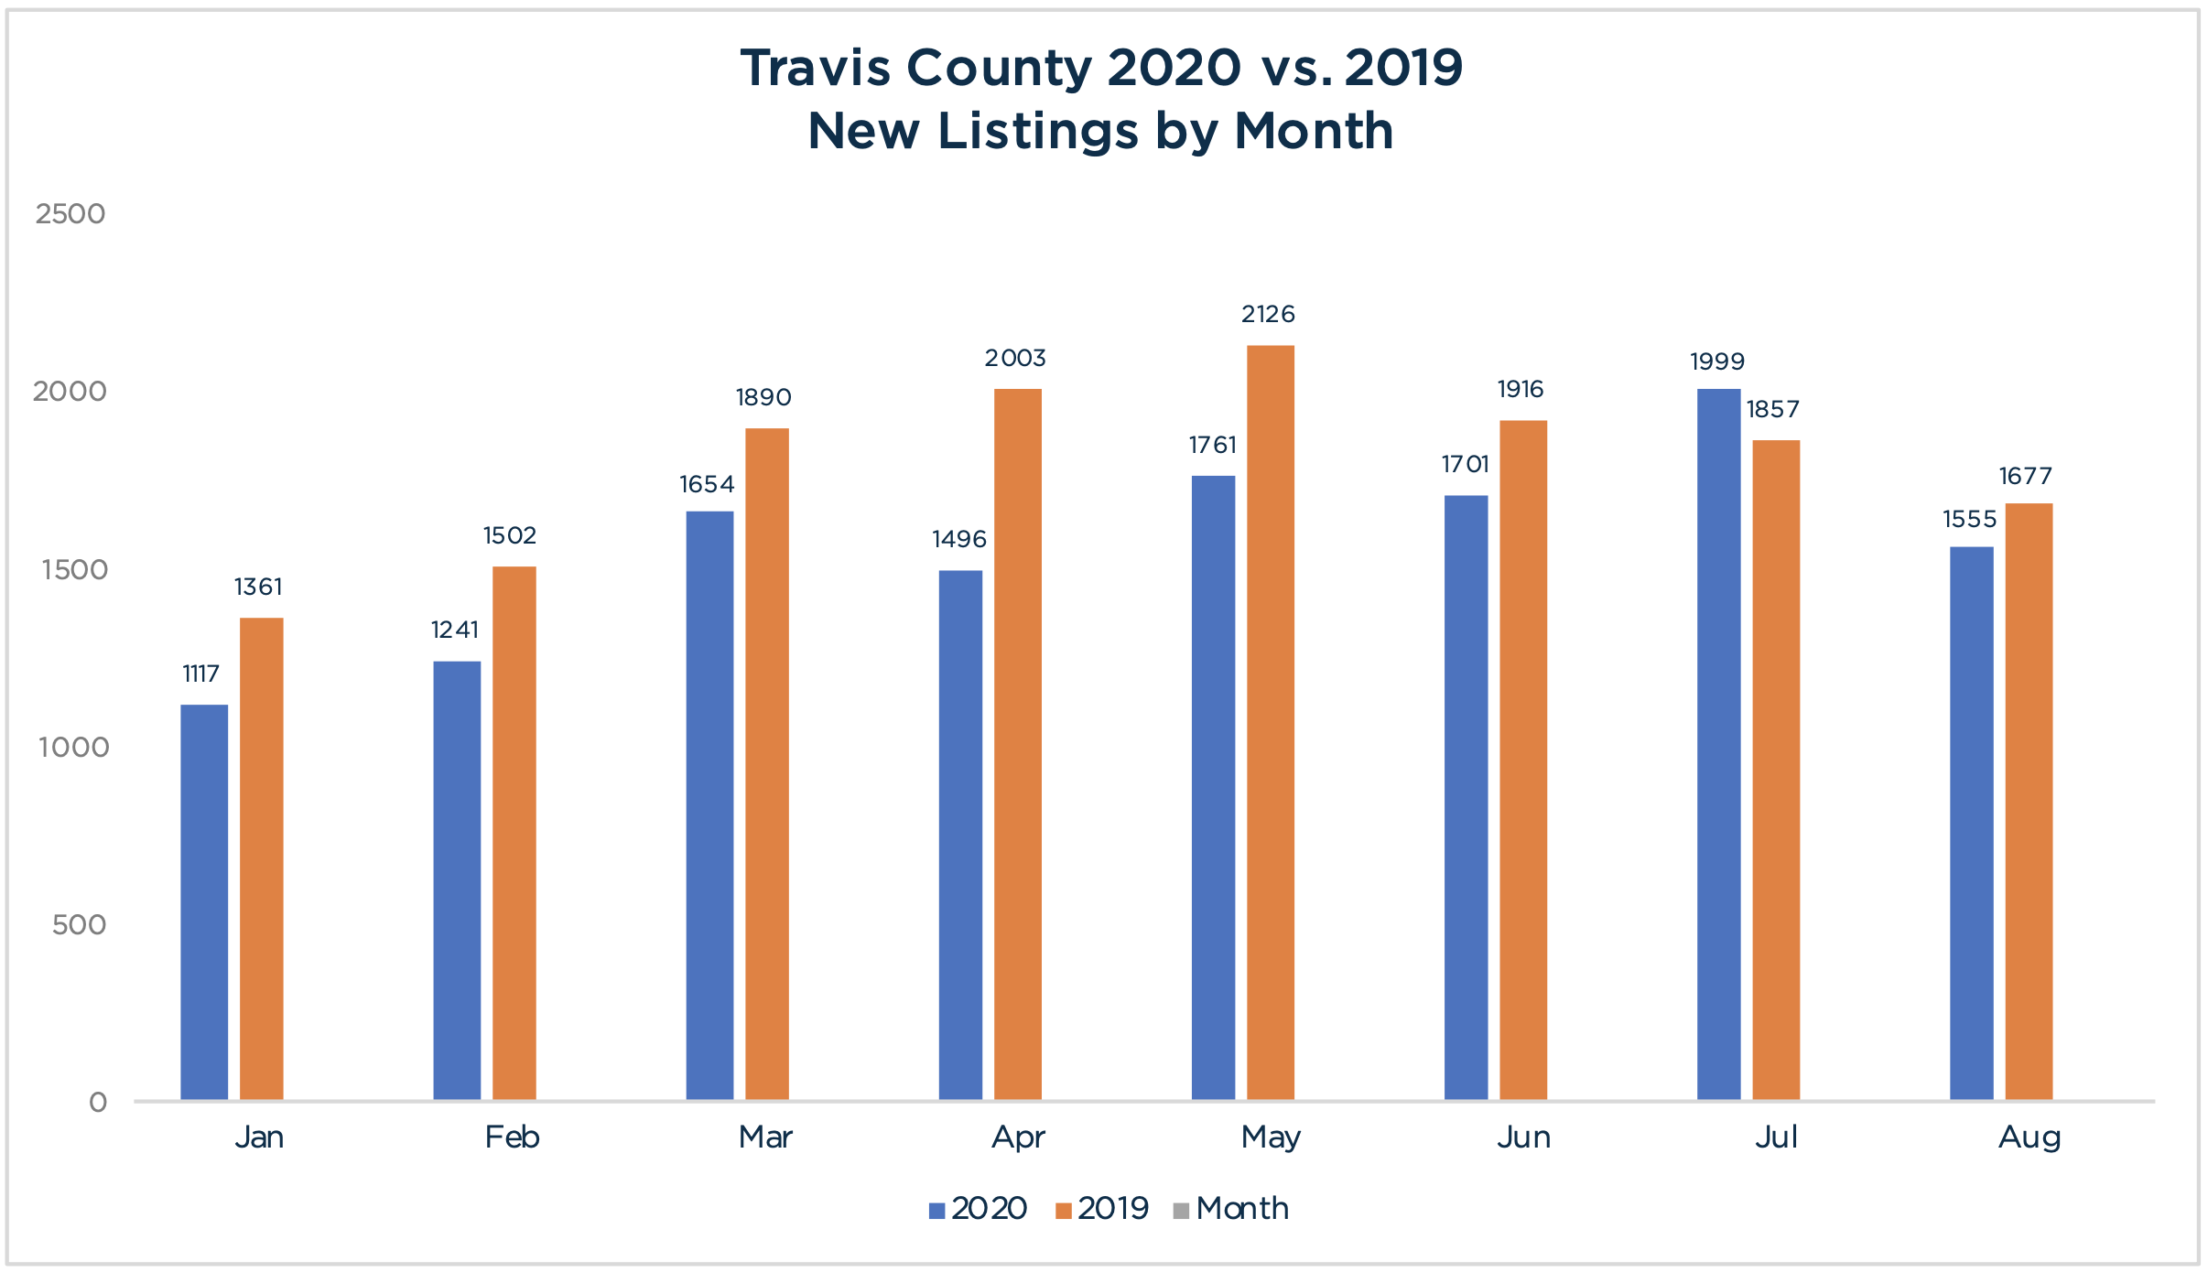
Unlike last month’s anomaly of new listings for July exceeding year-over-year numbers, new listings in August (1555) returned to 2020’s well established pattern of fewer new listings as compared to 2019, falling short of last August’s figures of 1677 new listings, a 7.3% drop.
Overall, new listings are down 12.6% year-to-date as compared to 2019.
Source: Austin Board of Realtors Travis County, as of September 2nd, 2020, for New and Existing Single Family Homes. Figures are preliminary and subject to revision based on ABoR’s upcoming report for August.
Weekly Supply/Demand Coverage Ratio
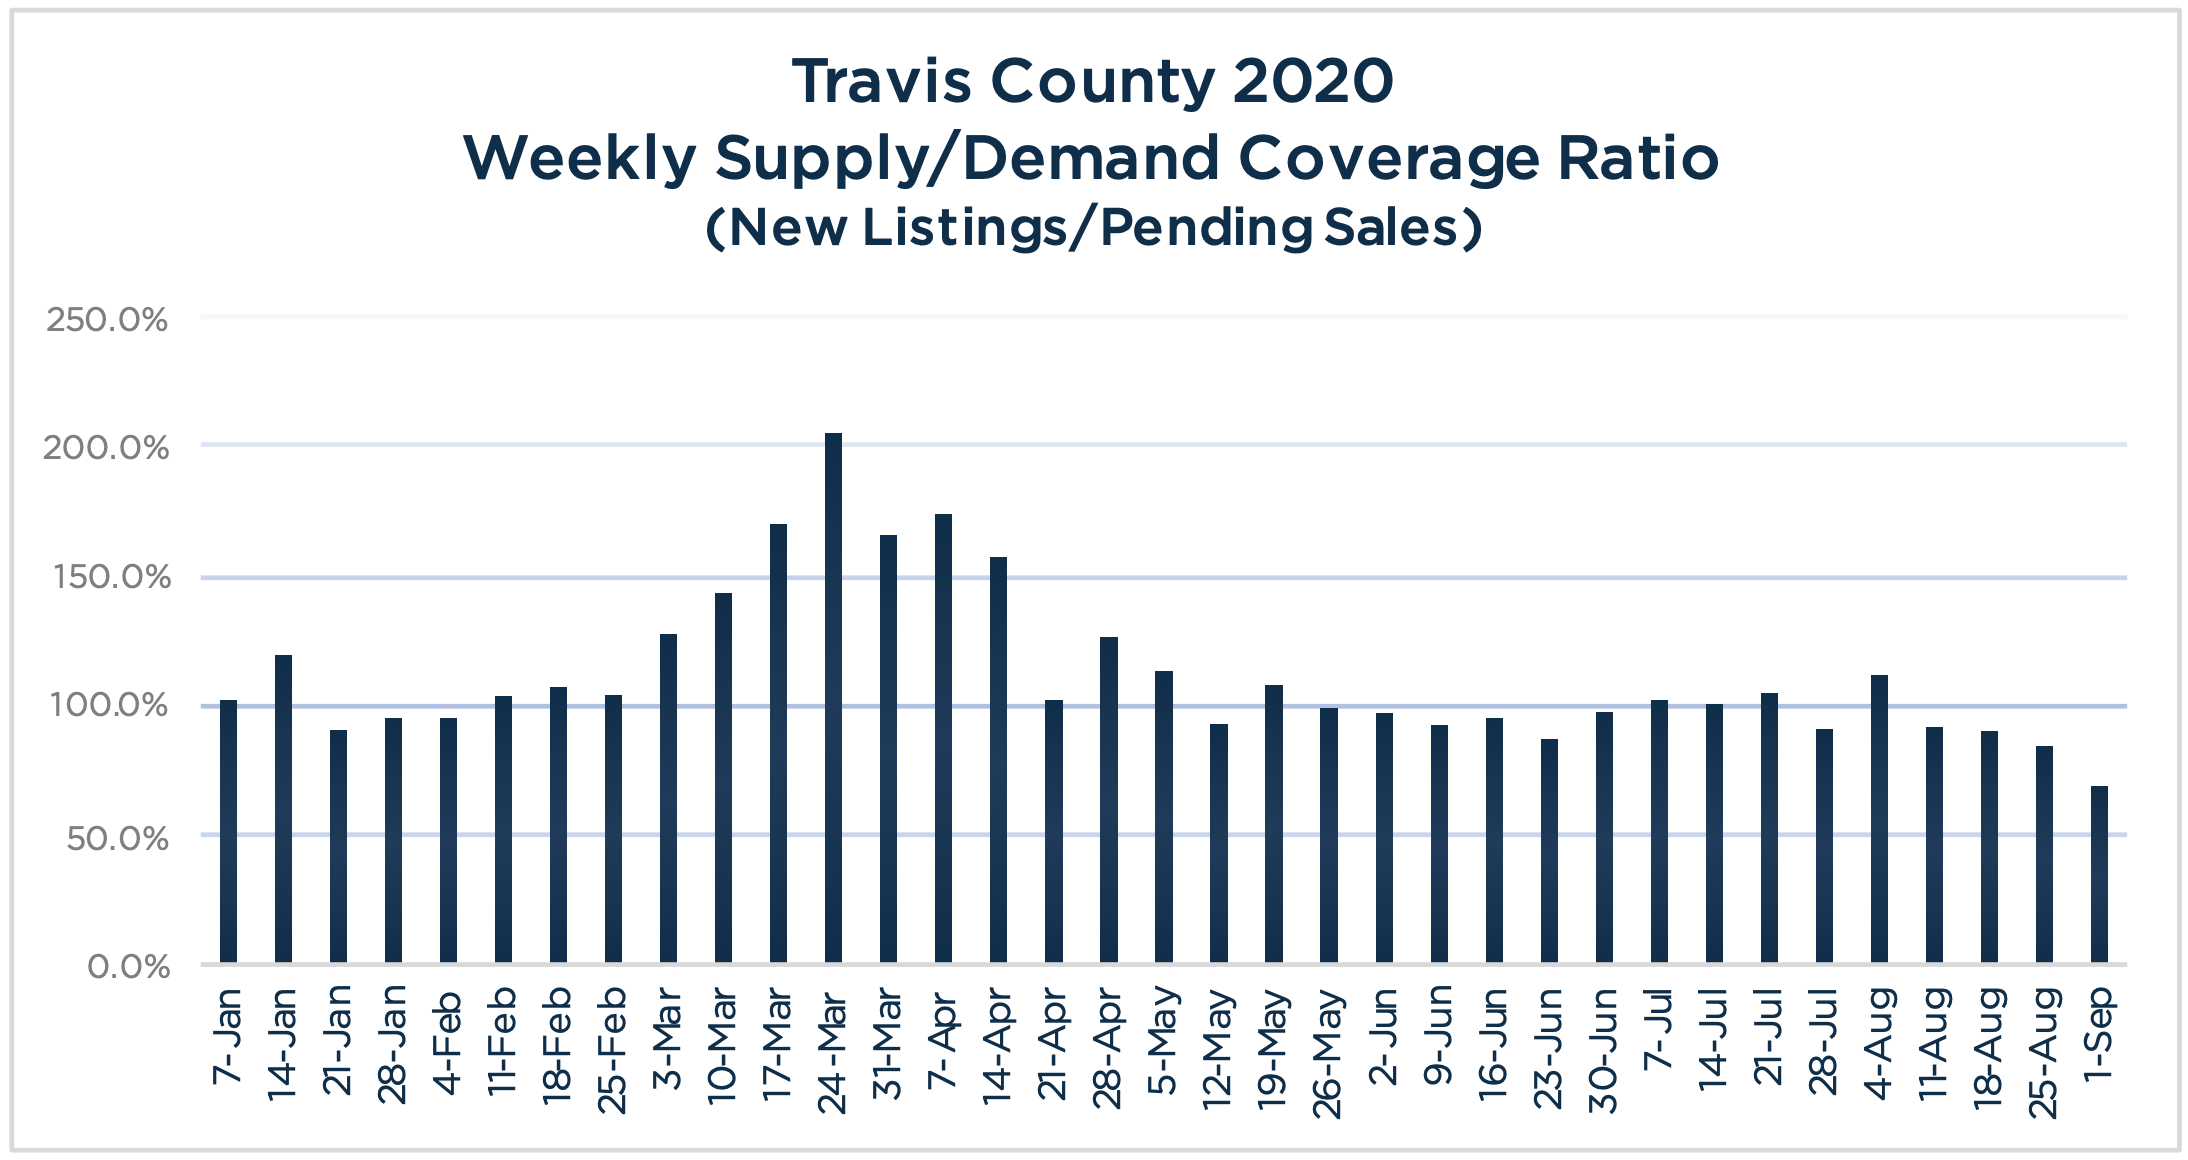
Supply (new listings) exceeded demand (pending sales) for the first week in August, before reversing course, with demand increasingly outpacing supply for four consecutive weeks to round out the month.
For the month of August, the actual inventory (total number of active listings) fell with 1,555 new listings and 1,836 pending sales, for a net decrease of 281 listings for sale.
Source: Austin Board of Realtors Travis County, as of September 2nd, 2020, for New and Existing Single Family Homes. Figures are preliminary and subject to revision based on ABoR’s upcoming report for August.
Maxavenue’s Weekly Supply/Demand Coverage Ratio calculation: number of new listings for the week divided by the number of pending sales in the week. 100% indicates no net change in listing inventory. Percentages over 100% indicate a growing inventory of listings for sale while anything lower than 100% reflects a shrinking inventory.
Monthly Housing Inventory
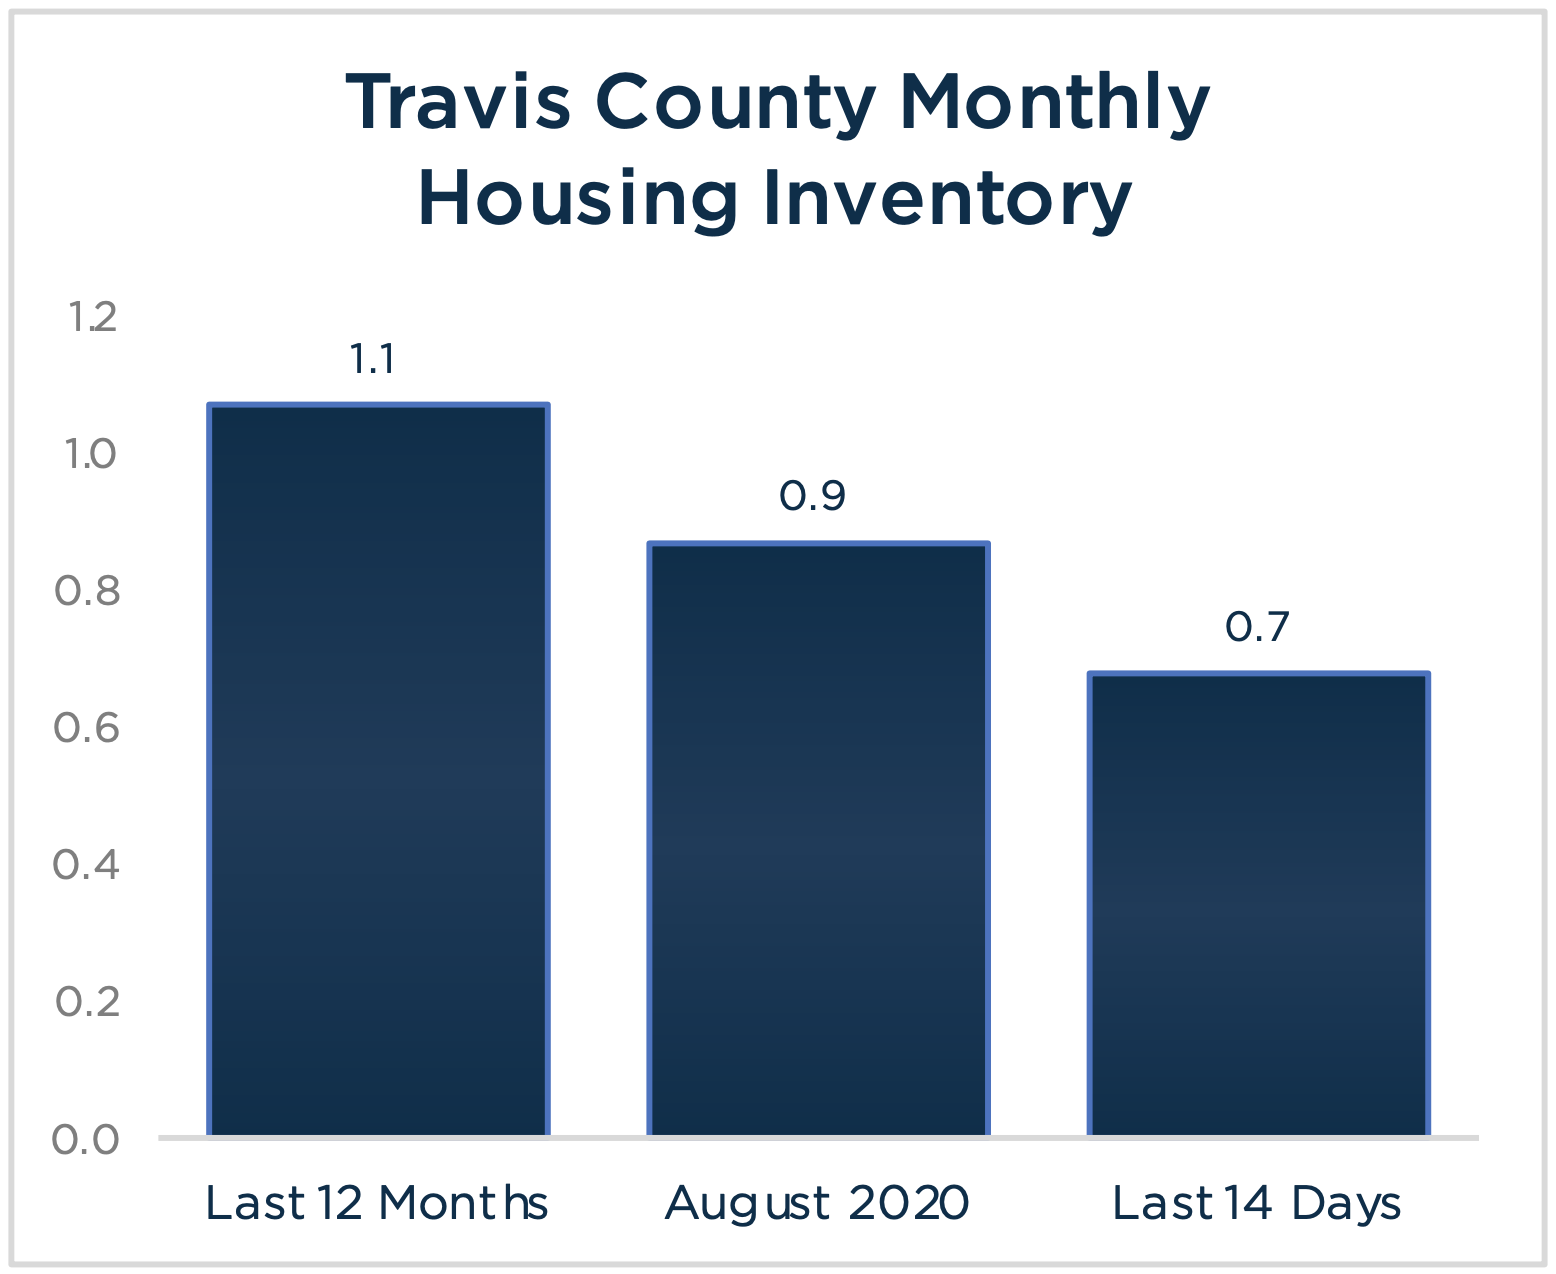
There were 1,331 active listings in Travis County at the end of August, based on preliminary numbers. Pending sales over the last 14 days of August (extrapolates to 1,961 sales) exceeded the pace set by 12-month average number of sales per month (1,242 sales), and when used as the Absorption Rate indicates a smaller current Monthly Housing Inventory of less than a month (.7) as compared to the 1.1-month inventory based on the 12-month average number of sales per month.
In contrast, using August’s Absorption (1,532 sales) indicates less than a 1-month supply of housing.
Regardless of the timeframe analyzed, Austin currently has a critically low shortage of housing inventory which continues upward pressure on pricing.
Source: Austin Board of Realtors Travis County, as of September 2nd, 2020, for New and Existing Single Family Homes. Figures are preliminary and subject to revision based on ABoR’s upcoming report for August.
Percentage of Sales & Listings by Price Segment
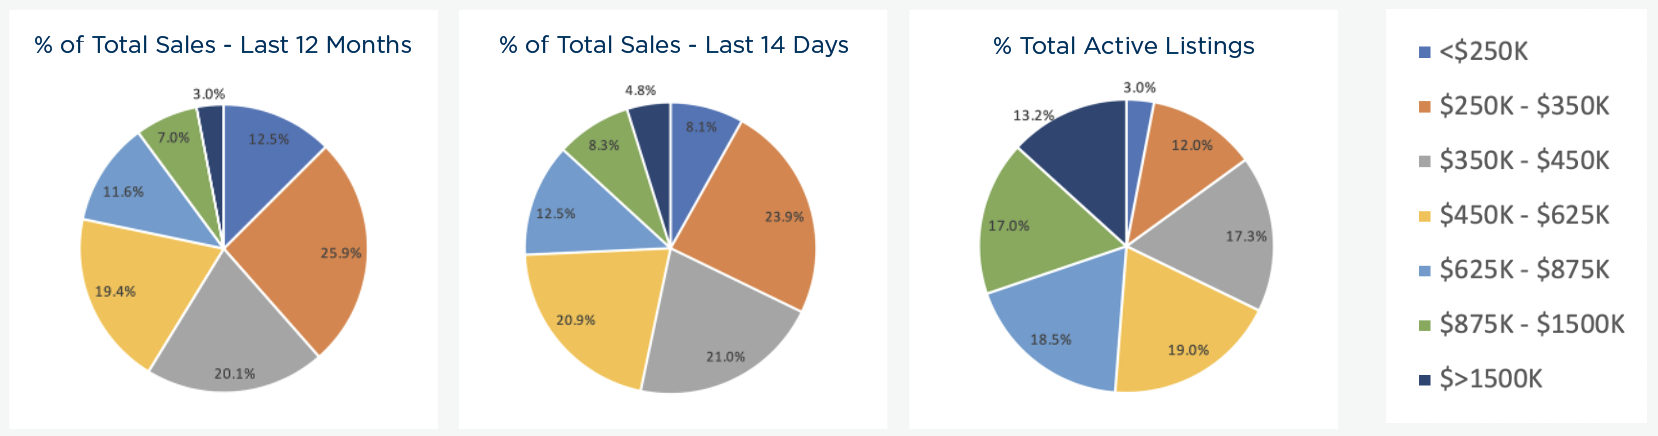
Sales over the past 14 days shows more activity for all price segments above $350,000, and less activity below $350,000, as compared to the 12-month average.
The movement toward more sales at higher price points is a reflection of price elasticity in the market based on strong demand and the limited inventory of homes at the lower price points.
As expected, the $250,000 to $350,000 segment remains the largest price segment, representing over 23.9% and 25.9% of total sales in the 14-day and 12-month timeframes, respectively, followed by $350,000 to $450,000 (21%, 20.1%) and $450,000 to $625,000 (20.9%, 19.4%).
Sales are also up for homes from $875,000 to $1,500,000, jumping from 7% of total sales over the past year, to 8.3% over the past 14 days, while sales over $1,500,000 have also jumped from 3% to 4.8% of total sales.
Although the percentages of sales by price segment are showing movement upward over the last 14 days of August vs. the 12-month average, the price segment distribution among active listings reflects the varying degrees of a housing shortage under $450,000.
For example, the $250,000 to $350,000 segment represented 23.9% of the sales over the past 14-days while only 12% of active listings fall into this category. Even worse, the under $250,000 segment represents 8.1% of all sales over the past 14 days, however only 3.0% of the listing inventory.
Both the shortage of listings at the lower end of the range and greater supply in the upper price segments work together to maintain upward pressure on prices in Travis County.
Source: Austin Board of Realtors Travis County, as of September 2nd, 2020, for New and Existing Single Family Homes. Figures are preliminary and subject to revision based on ABoR’s upcoming report for August.
Number of Sales by Price Segment
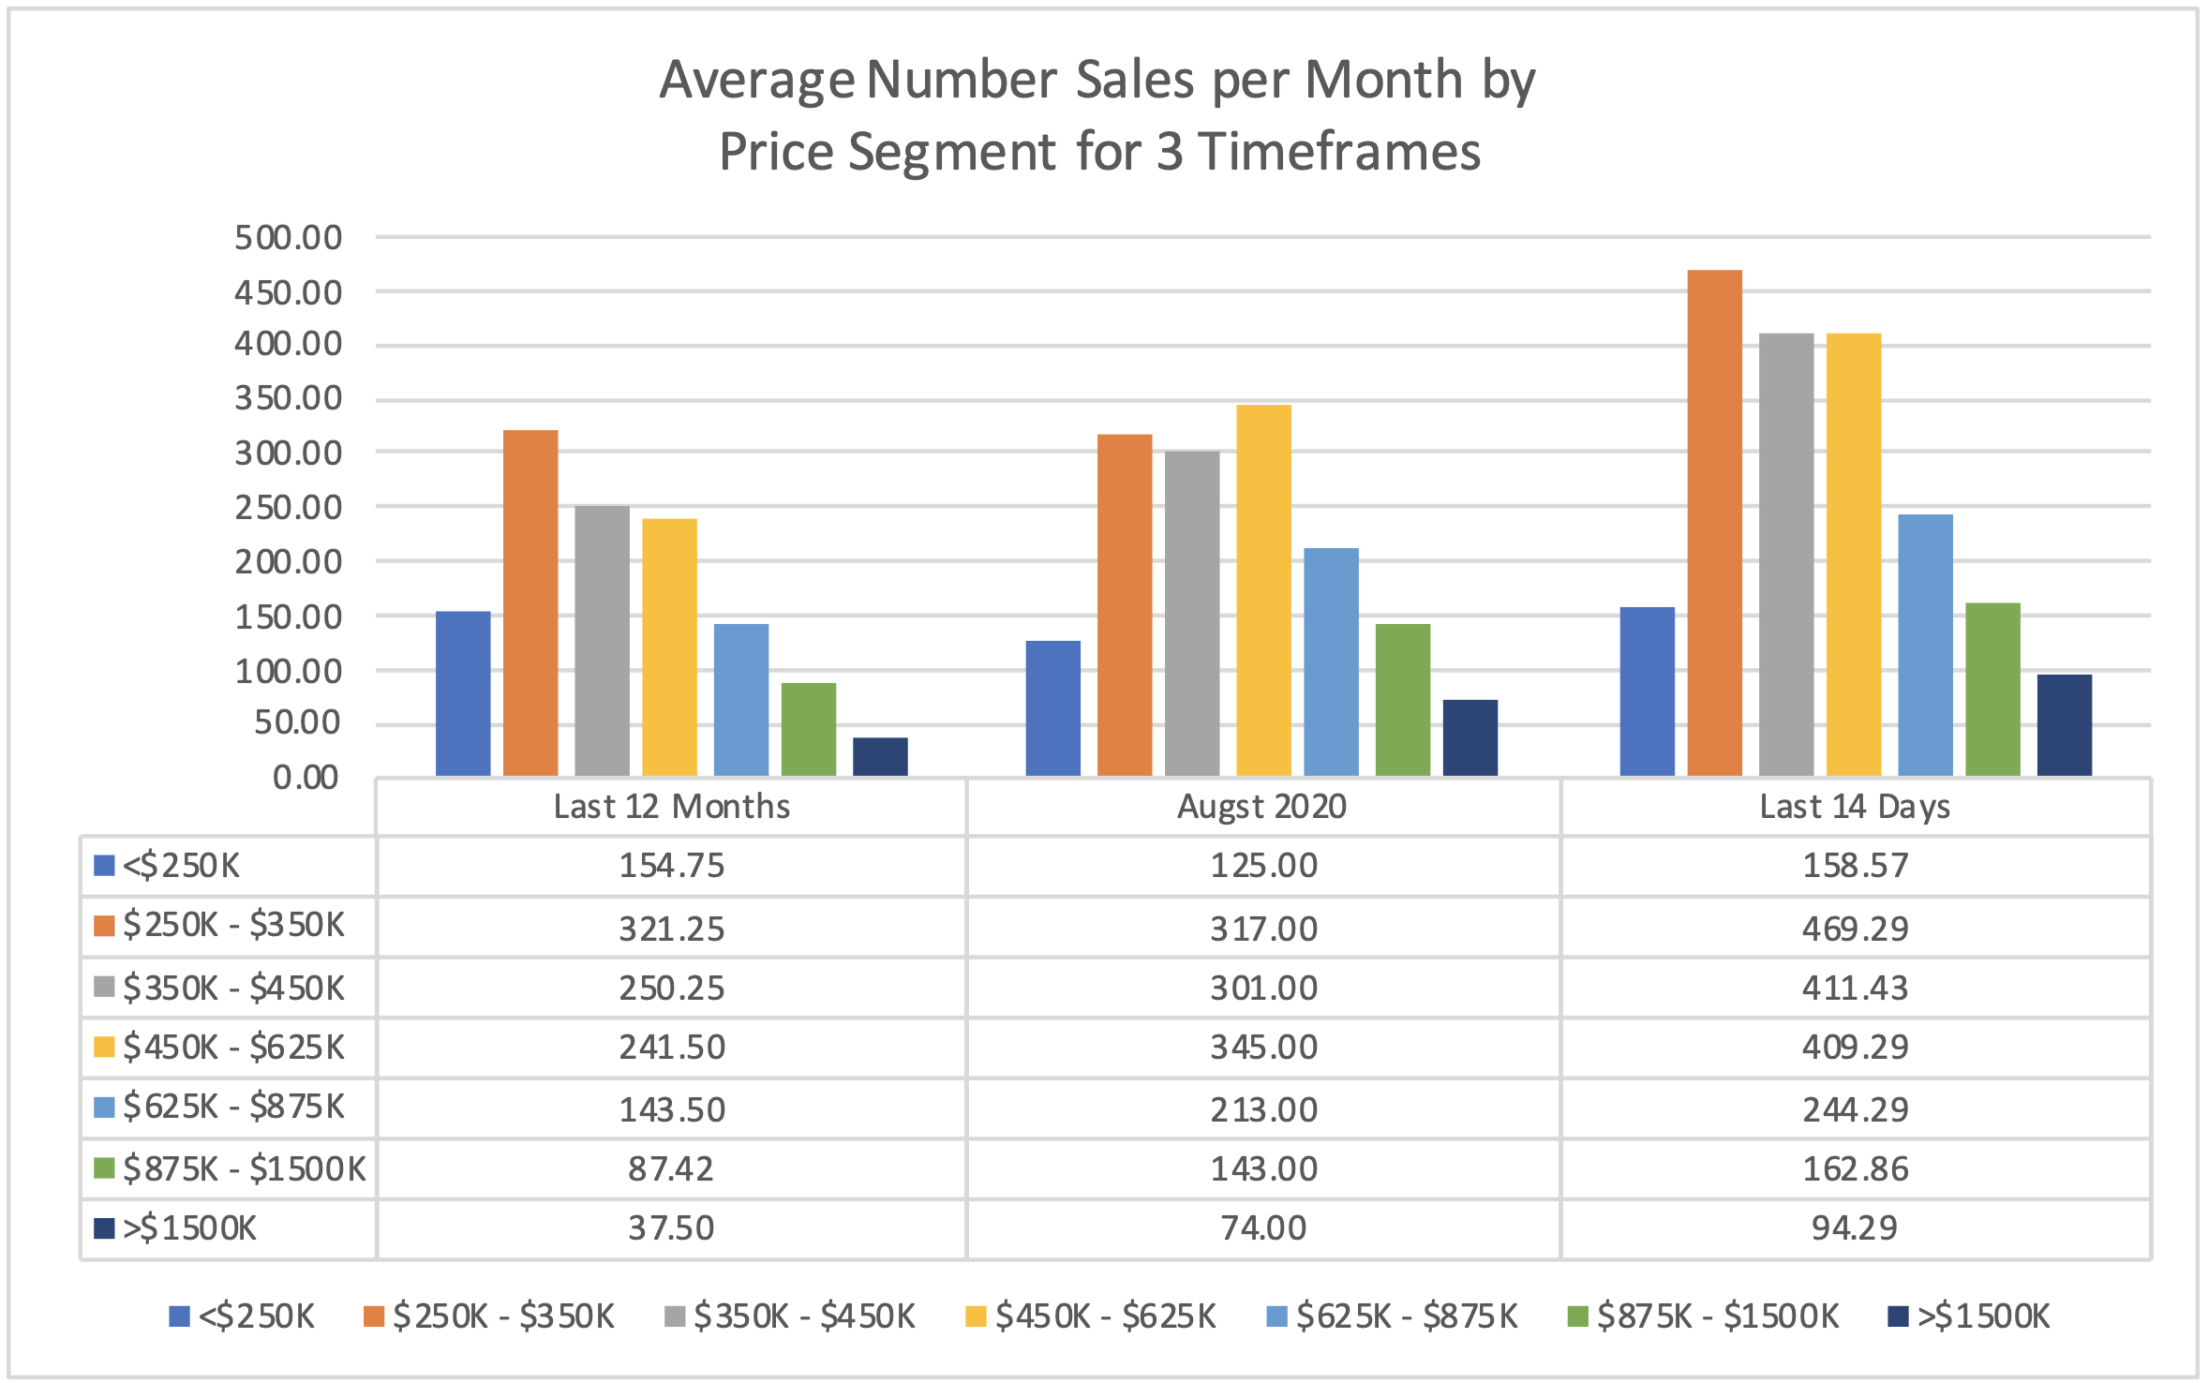
Pending sales over the past 14 days of all price segments over $250,000 are outpacing their 12-month average, with the largest jump of 151% in the $1,500,000 to $3,500,000 segment going from a 12-month average of 37.5 sales a month, to a monthly equivalent run rate of 94 sales based on pending sales from the past 14 days.
The $875,000 to $1,500,000 segment also saw a big increase of 86% based on a 12-month average of 87 sales to a monthly equivalent run rate of 163 sales based on pending sales from the past 14 days.
Source: Austin Board of Realtors Travis County, as of September 2nd, 2020, for New and Existing Single Family Homes. Figures are preliminary and subject to revision based on ABoR’s upcoming report for August.
Monthly Housing Inventory by Price Segment
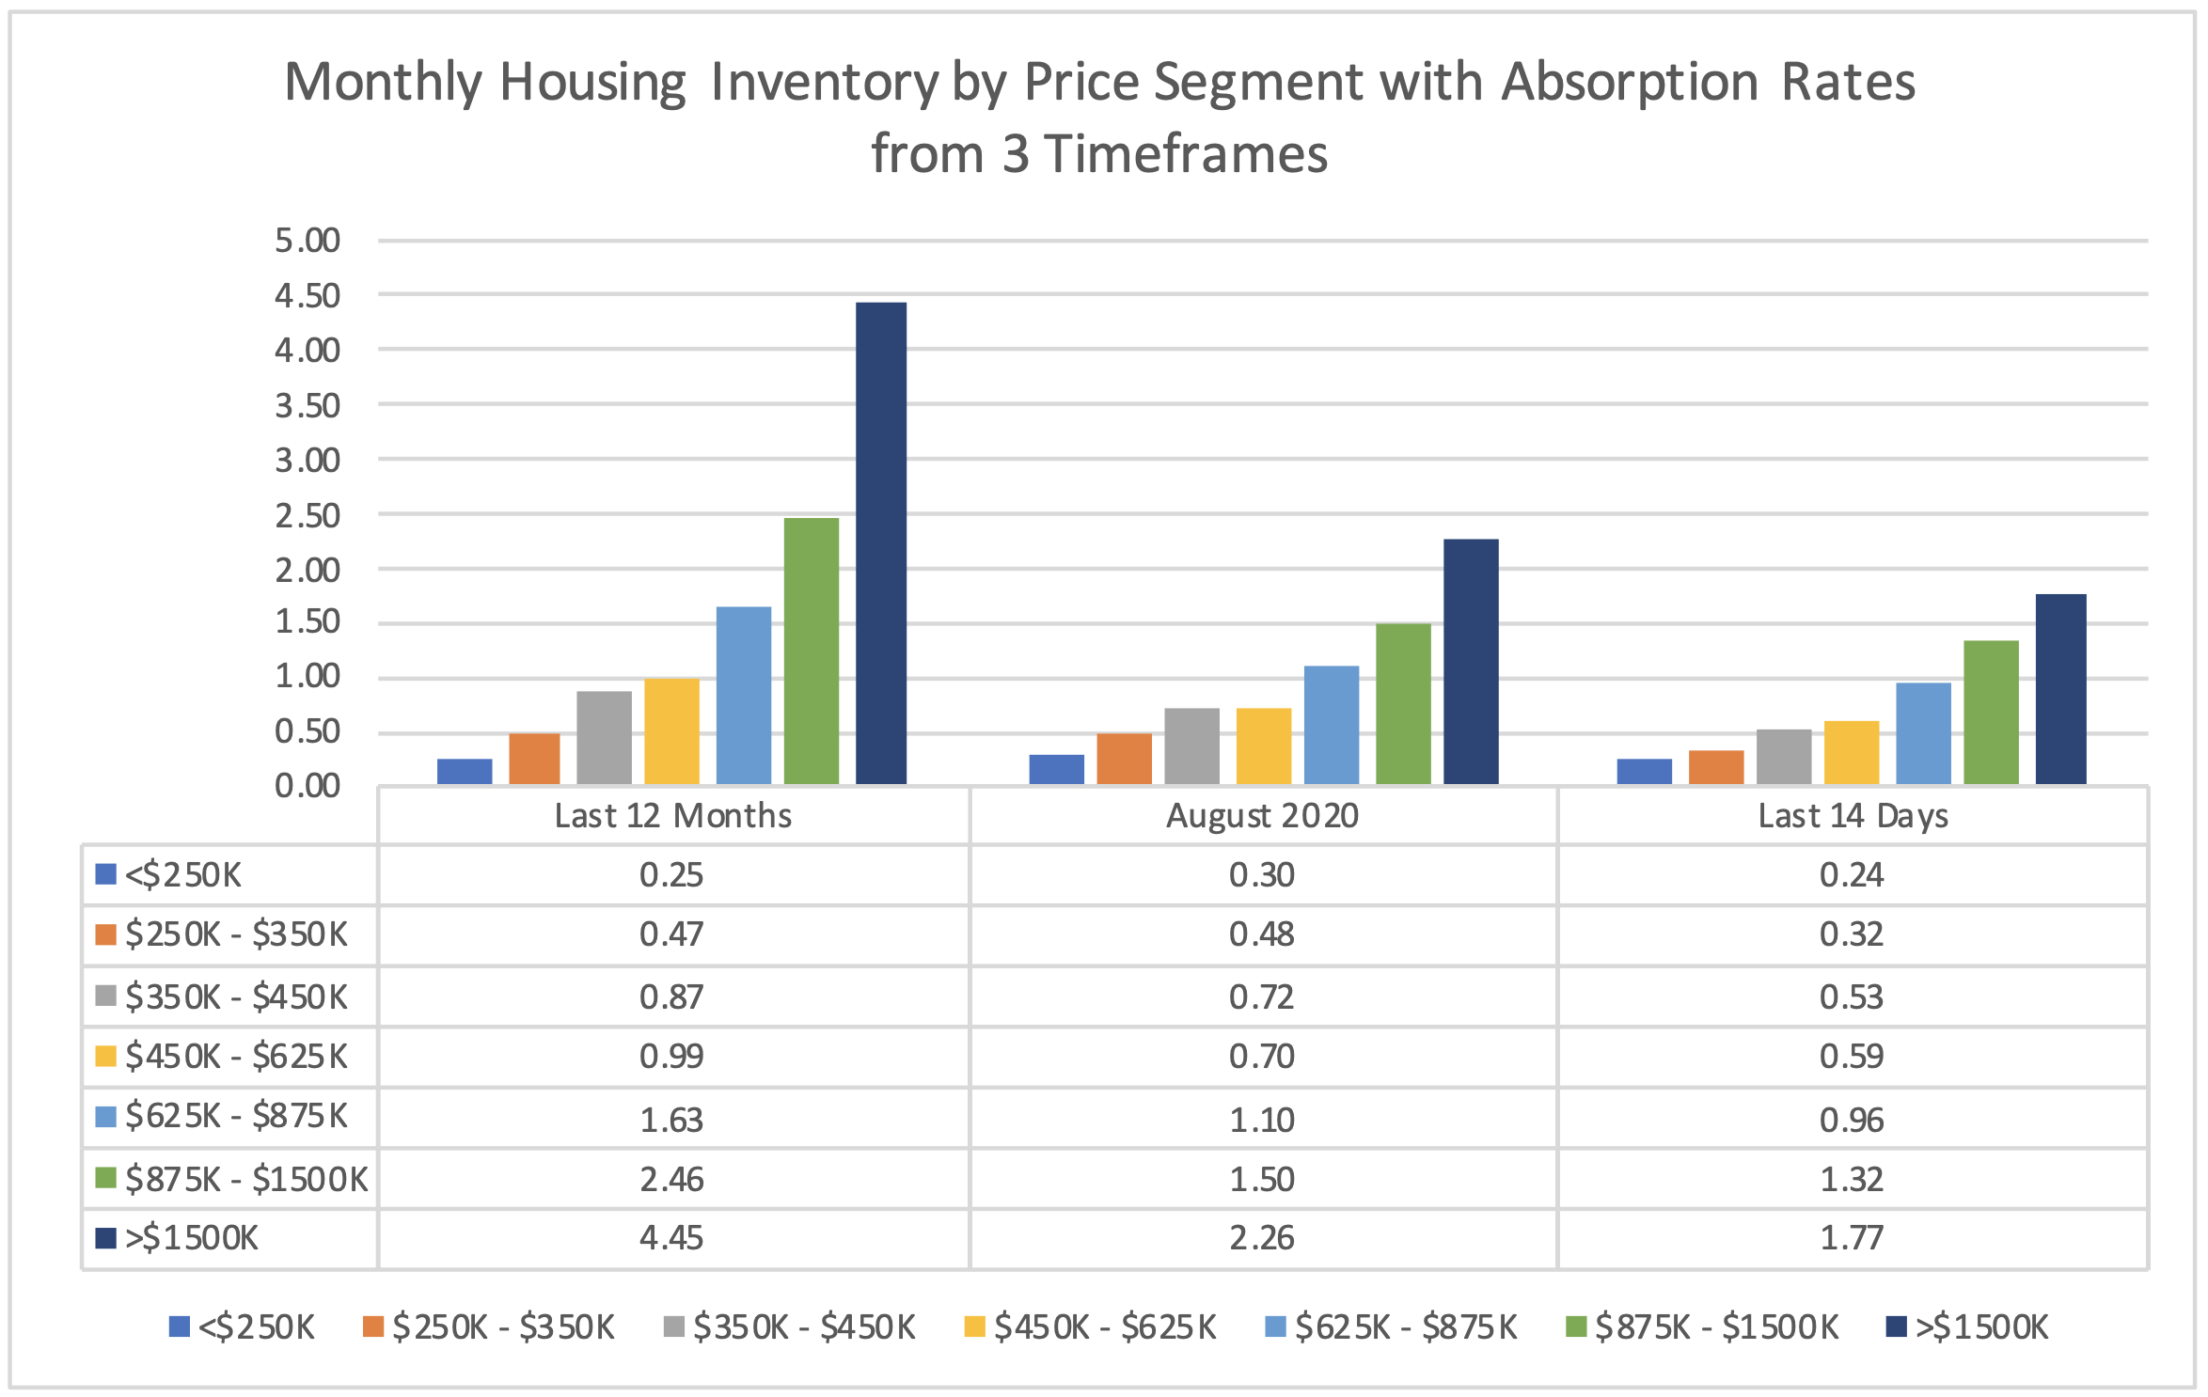
The combination of strong sales and limited active listings across the majority of price segments results in an extremely tight Monthly Housing Inventory. As expected, the $3,500,000+ tier has the largest supply, which currently stands at only a 5.5-month inventory based on the pending sales run rate over the past 14 days. This figure is down from a 11.24-month supply based on the 12-month average number of sales per month, and 4.2-months based on numbers from August, which puts upward pressure on pricing in this upper-end segment of the local market.
All other price segments have a critical shortage of available listings for sale which can only result in significant price appreciation given the increasingly strong demand shown in the pending sales data.
Source: Austin Board of Realtors Travis County, as of September 2nd, 2020, for New and Existing Single Family Homes. Figures are preliminary and subject to revision based on ABoR’s upcoming report for August.
Williamson County Report
Increased Velocity of Shrinking Inventory Accelerates Price Increases
The fact that Williamson County is a strong seller’s market is old news. However, the ongoing impact of supply (new listings) falling short of demand (pending sales) has increased the velocity of the shrinking inventory of listings for sale. As a result, we have early indications that the long-anticipated acceleration in price appreciation is underway.
The average price of July’s closed sales was $344,918, an 8.1% year over year increase as compared to the same time last year. Even stronger, the median price jumped to a $315,000, a 9.4% increase year-over-year as compared to 2019.
In contrast, the average sale in the prior months of 2020 ranged between a 5-7% increase as compared to 2019.
Preliminary figures from August indicate that the rate of price appreciation will continue and likely accelerate as we move into the fourth quarter, with the possibility of double-digit increases by the end of the year if the current trend continues.
Clearly, in spite of potential short-term fluctuations due to COVID-19, mid- and long-term forecasts for strong demand, limited housing supply and price appreciation remain intact.
Demand – Pending Sales
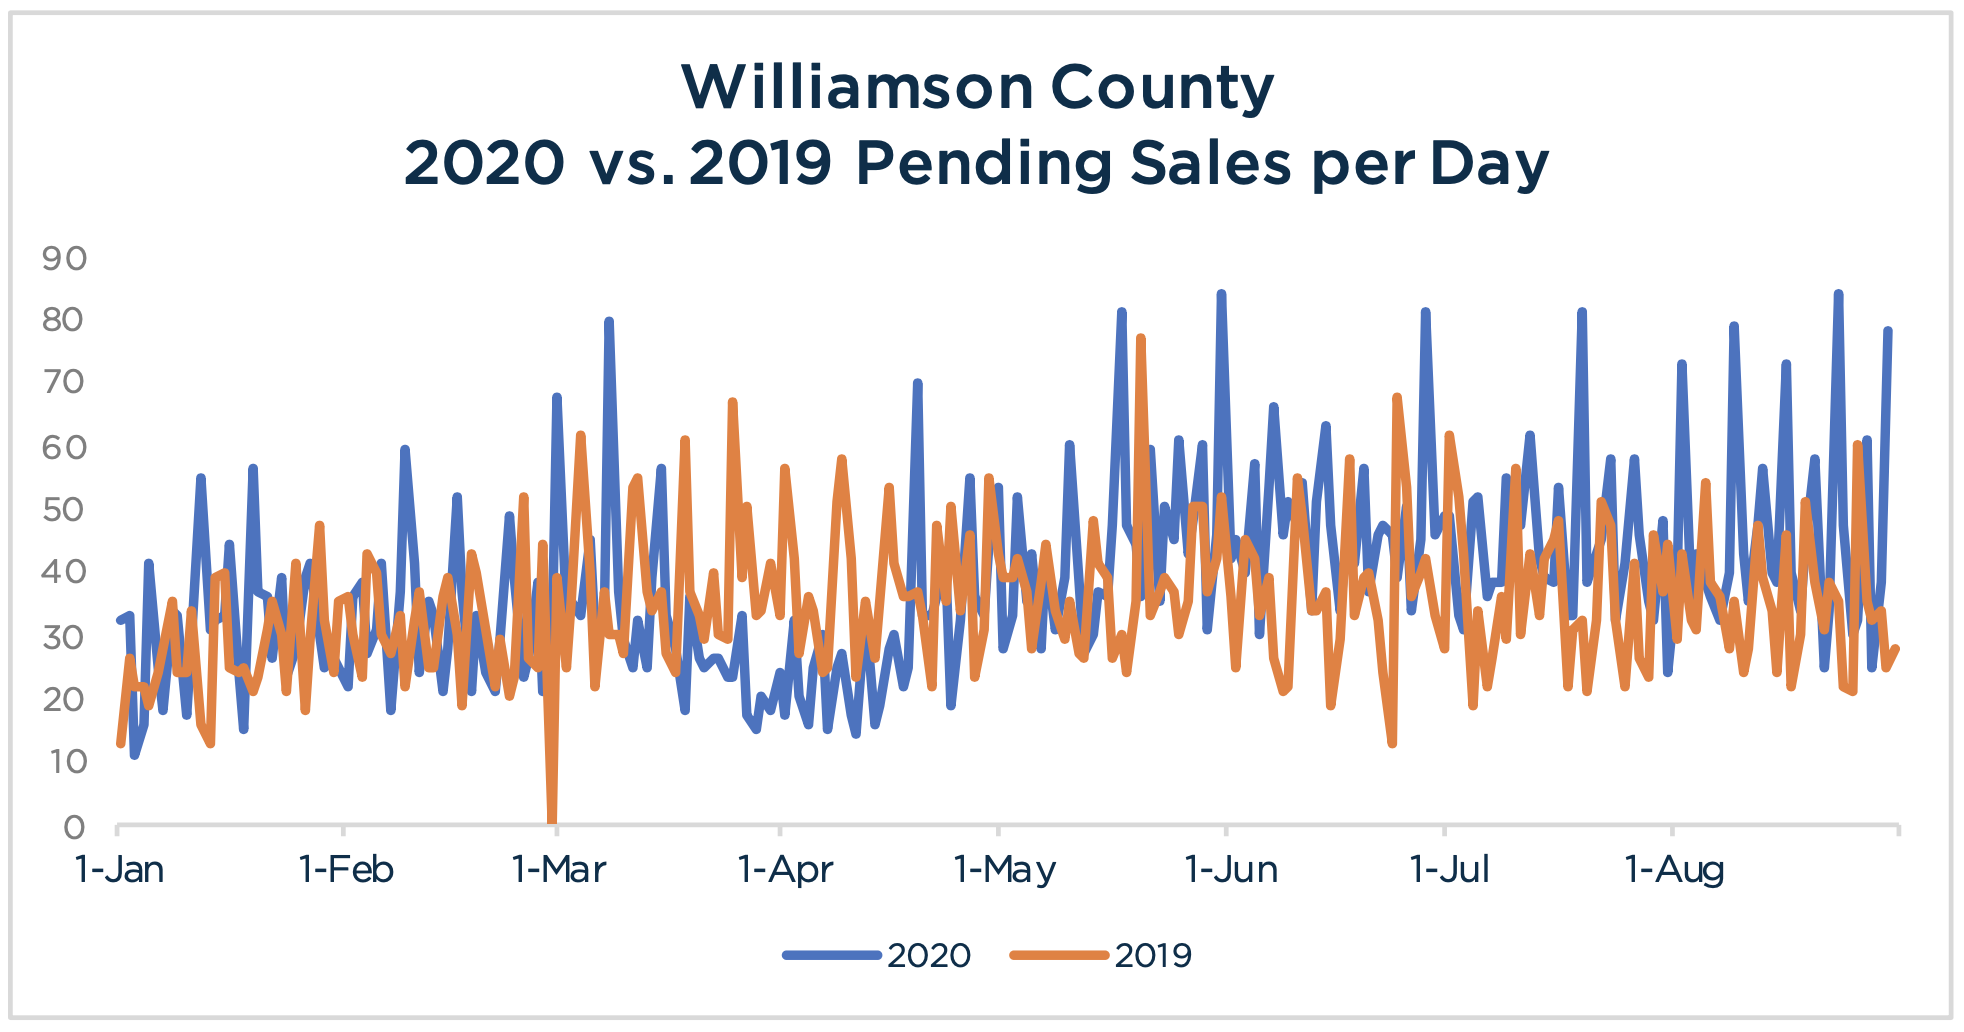
For the fourth consecutive month, pending sales for August were up year-over-year as compared to the same time last year. August’s figures were up 24.2% year over year, following the 22.3% mark in July, 34.6% in June, and 19.3% in May, which reflected a dramatic reversal after significant drops in March and April due to COVID-19.
Pending sales over the final 14 days of August were up more than 15% as compared to last year at the same time, which although not as robust as figures for the entire month, continue to exert upward pressure on pricing.
Source: Austin Board of Realtors Williamson County, as of September 2nd, 2020, for New and Existing Single Family Homes. Figures are preliminary and subject to revision based on ABoR’s upcoming report for August
Supply – New Listings
Returning to the trend from the first five months of 2020, August’s new listings fell short of year-over-year numbers from 2019 by 8.9%. The prior two months, July and June were the aberration, up 5.8% and 1.8% as compared to the same time last year.
Overall, new listings are down 10% year-to-date as compared to 2019.
Source: Austin Board of Realtors Williamson County, as of September 2nd, 2020, for New and Existing Single Family Homes. Figures are preliminary and subject to revision based on ABoR’s upcoming report for August
Weekly Supply/Demand Coverage Ratio
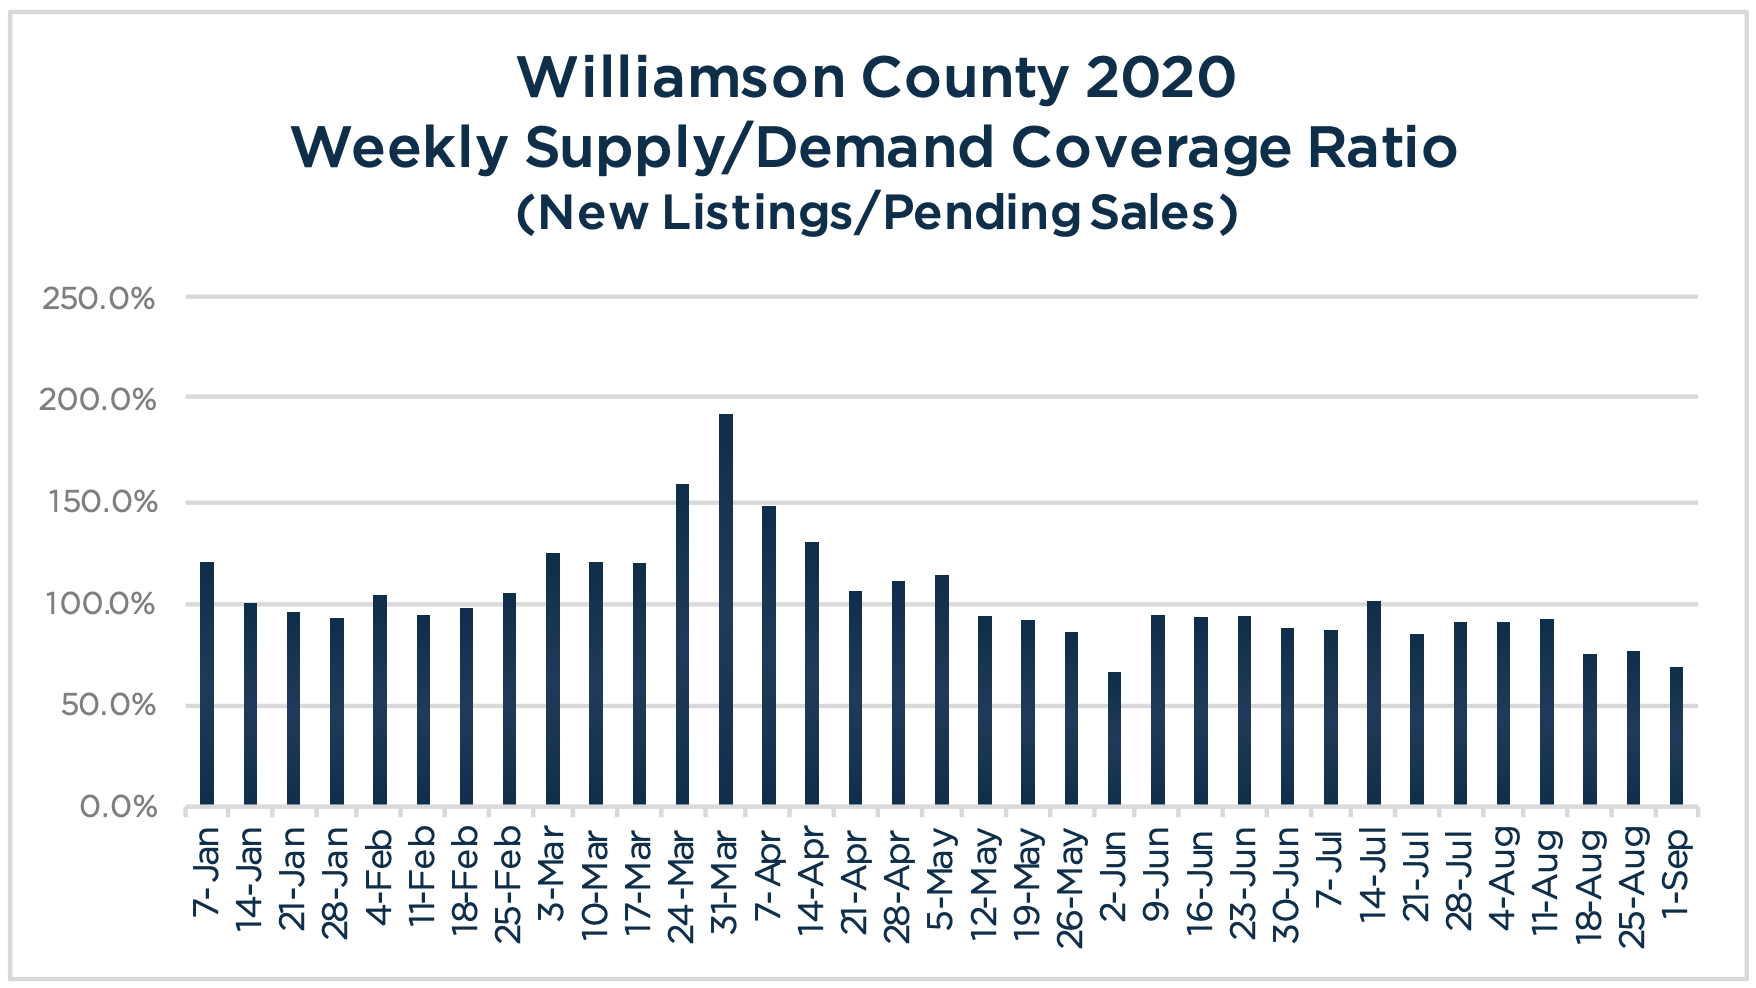
Demand (pending sales) has outpaced supply (new listings) for 16 of the past 17 weeks after reversing an eleven week run from mid-February through the end of April which saw more new listings hitting the market per week than pending sales, as a result of COVID-19.
Most recent indicators, however, show demand continuing to gain momentum, accelerating the pace by which it exceeds supply, increasing the velocity of a shrinking inventory of listings for sale.
Source: Austin Board of Realtors Williamson County, as of September 2nd, 2020, for New and Existing Single Family Homes. Figures are preliminary and subject to revision based on ABoR’s upcoming report for August
Maxavenue’s Weekly Supply/Demand Coverage Ratio is calculation: number of new listings for the week divided by the number of pending sales in the week. 100% indicates no net change in listing inventory. Percentages over 100% indicate a growing inventory of listings for sale while anything lower than 100% reflects a shrinking inventory.
Monthly Housing Inventory
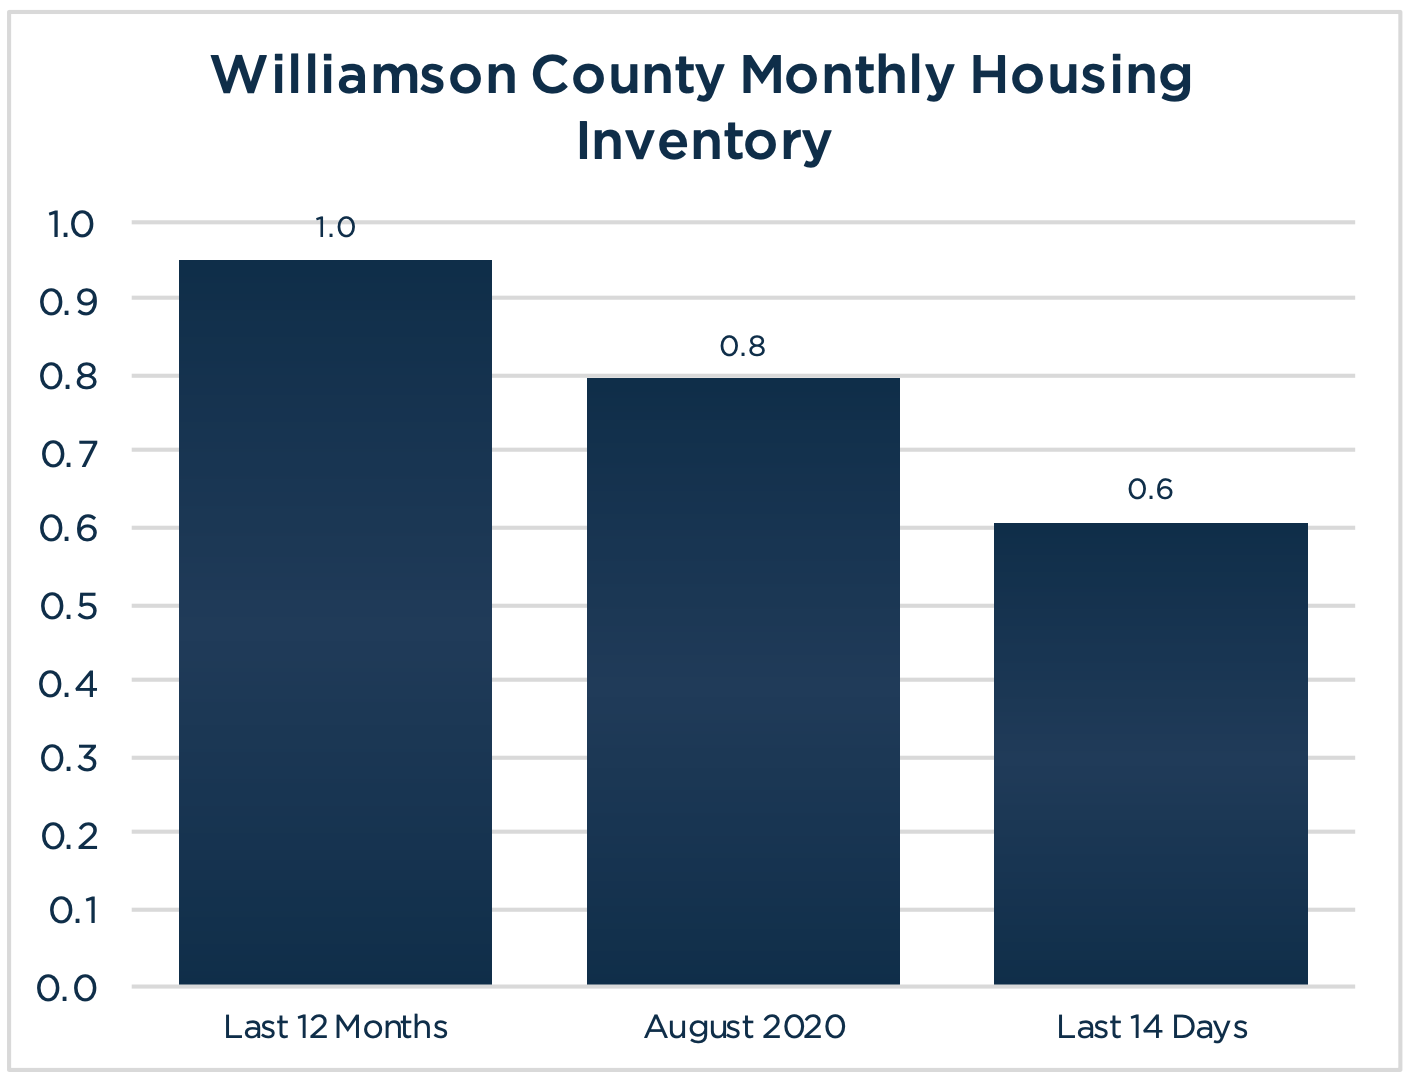
There were 926 active listings in Williamson County at the end of August, based on preliminary numbers. Pending sales over the last 14 days of August (extrapolates to 1,527 sales) exceeded the pace set by 12-month average number of sales per month (974 sales), and when used as the Absorption Rate indicates a smaller current Monthly Housing Inventory of less than a month (.6) as compared to the 1-month inventory based on the 12-month average number of sales per month.
In contrast, using August’s Absorption (1,163 sales) indicates a .8-month supply of housing.
Regardless of the timeframe analyzed, Williamson County currently has a critically low shortage of housing inventory which continues upward pressure on pricing.
Source: Austin Board of Realtors Williamson County, as of September 2nd, 2020, for New and Existing Single Family Homes. Figures are preliminary and subject to revision based on ABoR’s upcoming report for August
Percentage of Sales & Listings by Price Segment
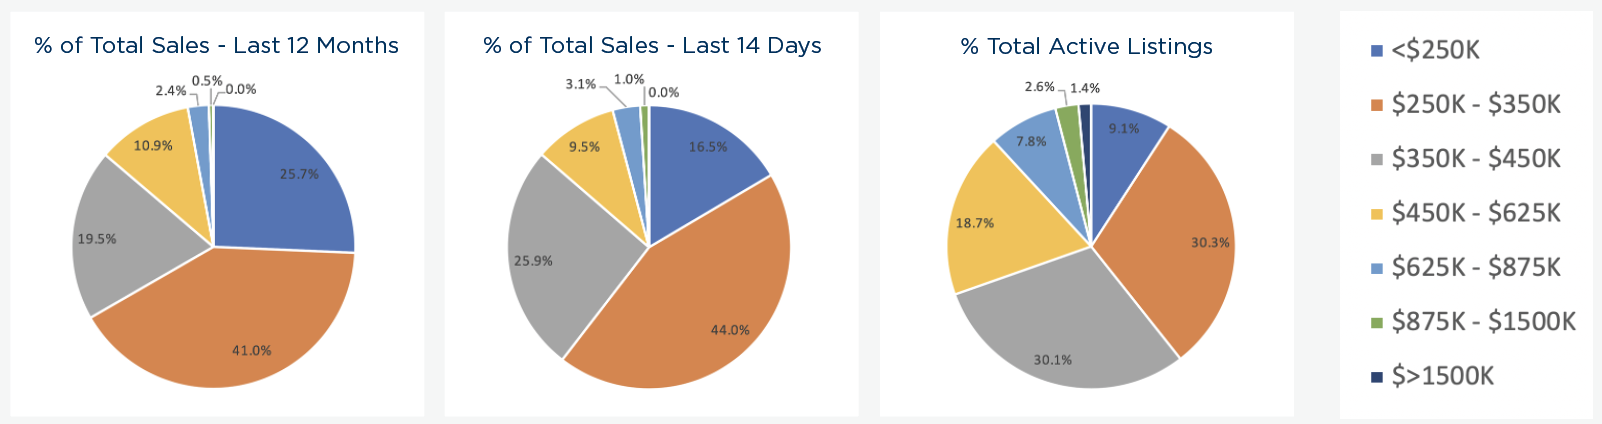
Sales in the $250,000 to $350,000 price segment continue to represent the largest share of Williamson County’s sales volume at 44% of total sales over the last 14 days of August, up from 4% of the total over the past 12 months.
Other price segments that experienced significant growth as a percentage of total sales include $350,000 to $450,000 which jumped from 19.5% of the 12-month total to 25.9% over the last 14 days of August, and to a lesser degree the >$1,500,000 segment which grew from .5% to 1% of total sales for the same time periods.
Two segments saw a decline, with <$250,000 dropping from 25.7% of the 12-month total to 16.5% based on the last 14 days of August and $450,000 to $625,000 falling from 10.9% to 9.5% for the same time periods.
While the percentages of sales by price segment are showing movement upward over the last 14 days vs. the 12-month average, the price segment distribution among active listings reflects the housing shortage under $350,000.
For example, the $250,000 to $350,000 segment represents 44% of all sales over the past 14 days, however only 30.3% of the listing inventory falls into this price segment.
In contrast, price segments over $350,000 reflect a greater percentage of the total active listings in comparison to sales.
Both the shortage of listings at the lower end of the range and greater supply in the upper price segments work together to maintain upward pressure on prices in Williamson County.
Source: Austin Board of Realtors Williamson County, as of September 2nd, 2020, for New and Existing Single Family Homes. Figures are preliminary and subject to revision based on ABoR’s upcoming report for August
Number of Sales by Price Segment
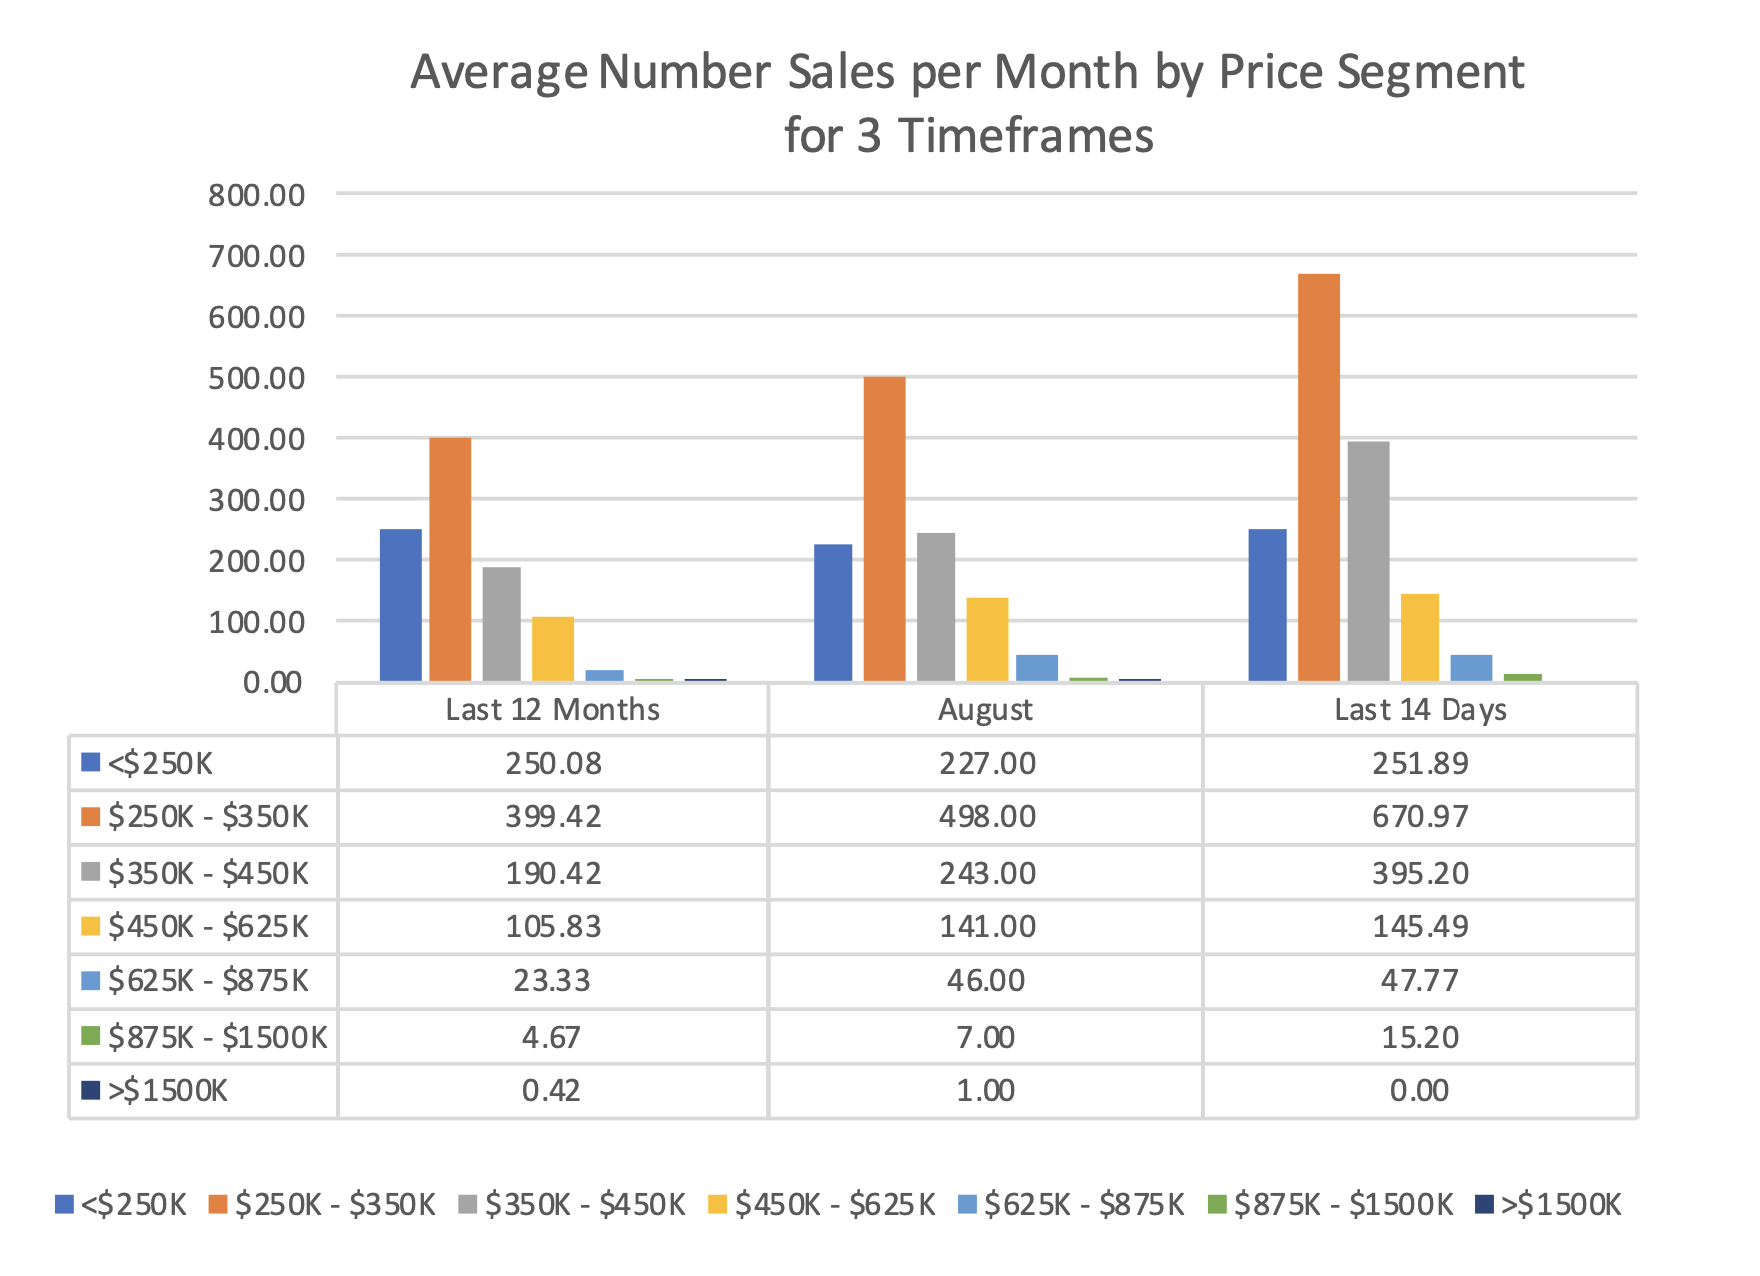
Pending sales over the past 14 days of all price segments are significantly outpacing their 12-month average, with the largest jump of 225.7% in the $875,000 to $1,500,000 price segment from a 12-month average of 4.67 sales a month to monthly equivalent run rate of 15 sales based on pending sales from the past 14 days.
The $350,000 to $450,000 price segment also saw a big increase, going from a 12-month average of 279 sales a month, to a monthly equivalent run rate of 395 sales based on pending sales from the past 14 days.
Another big mover, the $625,000 to $875,000 price segment increased from a 12-month average of 23 sales a month, to a monthly equivalent run rate of 48 sales based on pending sales from the past 14 days.
Source: Austin Board of Realtors Williamson County, as of September 2nd, 2020, for New and Existing Single Family Homes. Figures are preliminary and subject to revision based on ABoR’s upcoming report for August
Monthly Housing Inventory by Price Segment
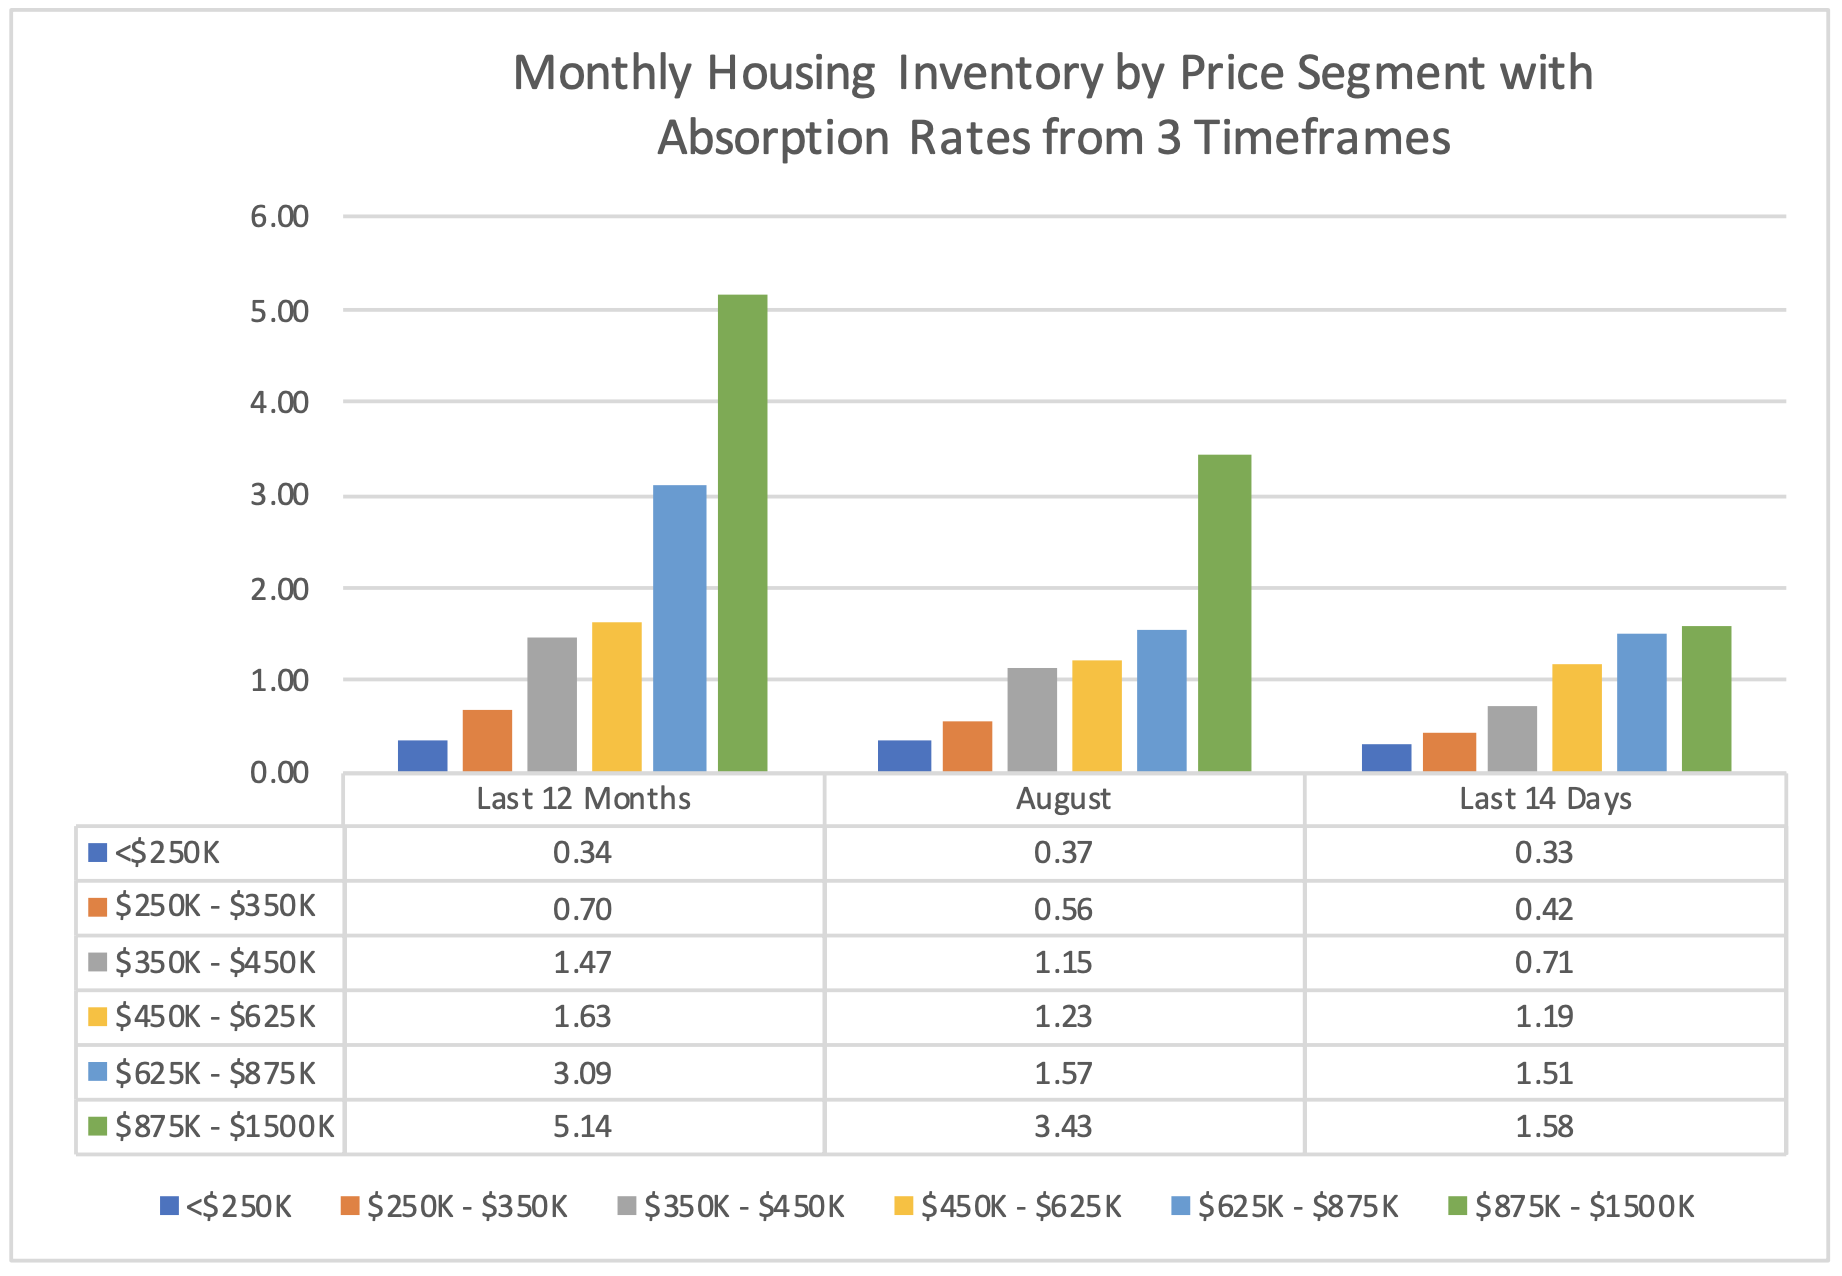
The combination of strong sales and limited active listings across the majority of price segments results in an extremely tight Monthly Housing Inventory across the array of price segments.
With the large jump in number of sales per month as compared to the 12-month average, the $875,000 to $1,500,000 segment had the most dramatic drop in Monthly Housing Inventory of 69.3%, going from a 5.14 month supply based on the 12-month average number of sales per month, down to 1.58 months over the past 14-days, which puts upward pressure on pricing in this segment.
The $350,000 to $450,000 segment also saw a significant tightening (51.8%) of available homes for sale, going from a 1.47-month supply based on the 12-month average number of sales per month, down to .71% months over the past 14-days.
In addition, the $625,000 to $875,000 segment also had a large drop (51.2%) of available homes for sale, going from a 3.09 month supply based on the 12-month average number of sales per month, down to 1.51% months over the past 14-days.
Source: Austin Board of Realtors Williamson County, as of September 2nd, 2020, for New and Existing Single Family Homes. Figures are preliminary and subject to revision based on ABoR’s upcoming report for August
Research and analysis included in this report is based on preliminary data from Austin Board of Realtors MLS which is subject to updates for up to three months after data release.


Share this article with your network!