
Austin Real Estate Market Report
Travis County Report
Luxury Market Heats Up as Overall Demand Remains Strong
Latest figures from July highlight the dramatic increase over the past month in pending sales above $1,500,000, which are more than double the 12-month average of 34 sales a month in this upper end price segment.
Overall, demand remains very strong across all price points, fueled by historically low interest rates and Austin’s dynamic economic base, while the anemic housing inventory continues to dwindle.
As we begin August, Travis County remains an attractive relocation destination from higher priced locations around the country. This is amplified by the increasingly prevalent work-from-home trend along with Austin’s comparative affordability and high-tech infrastructure
In spite of potential short-term fluctuations due to COVID-19, mid- and long-term forecasts for strong demand, limited housing supply and price appreciation remain intact.
Demand – Pending Sales
Pending sales in July were up 11.8% year-over-year as compared to the same time last year. This rebound continues the turnaround that began in May after bottoming out in April and March, due to COVID-19.
The pace of pending sales over the last 14 days of July was up 11% as compared to last year at the same time, which reflects strong demand and maintains upward pressure on pricing.
Overall, pending sales are down 4.7% year-to-date as compared to 2019.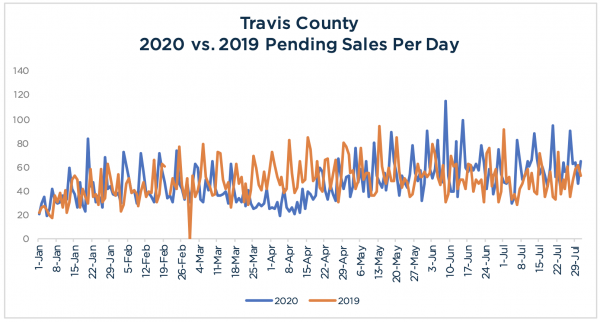
Source: Austin Board of Realtors Travis County, as of August 2nd, 2020, for New and Existing Single Family Homes
Supply – New Listings
For the first time in 2020, new listings for July exceeded year-over-year numbers from 2019, but not by much. Preliminary statistics show 1,905 new listings in July, a 2.6% increase as compared to July 2019’s figure of 1,857.
Overall, new listings are down 14.1% year-to-date as compared to 2019.
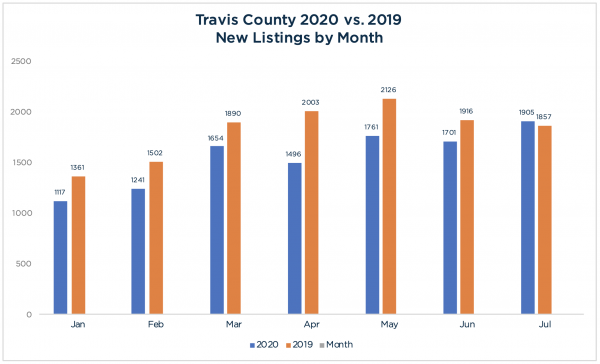
Source: Austin Board of Realtors Travis County, as of August 2nd, 2020, for New and Existing Single Family Homes
Weekly Supply/Demand Coverage Ratio
Supply (new listings) outpaced demand (pending sales) for the first three weeks of July, before reversing back to demand outpacing supply pattern of the prior six weeks dating back to late-May.
For the month of July, the actual inventory (total number of active listings) grew with 1,905 new listings and 1,818 pending sales for a net increase of 87 listings for sale.
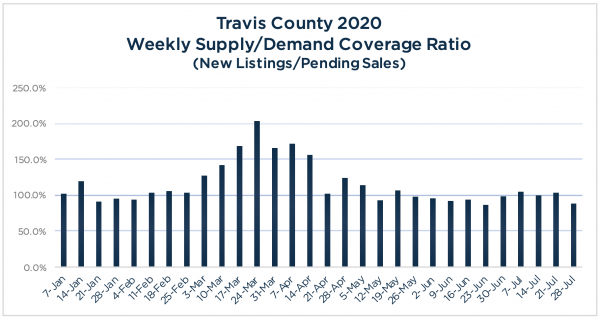
Source: Austin Board of Realtors Travis County, as of August 2nd, 2020, for New and Existing Single Family Homes
Maxavenue’s Weekly Supply/Demand Coverage Ratio is calculated by the number of new listings for the week divided by the number of pending sales in the week. 100% indicates no net change in listing inventory. Percentages over 100% indicate a growing inventory of listings for sale while anything lower than 100% reflects a shrinking inventory.
Monthly Housing Inventory
There were 1,660 active listings in Travis County at the end of July, based on preliminary numbers. Pending sales over the last 14 days of July (extrapolates to 1,876 sales) exceeded the pace set by 12-month average number of sales per month (1,241 sales). The Absorption Rate indicates a smaller current Monthly Housing Inventory of less than a month (.9) as compared to the 1.3-month inventory based on the 12-month average number of sales per month.
In contrast, using July’s Absorption (1,696 sales) indicates a 1-month supply of housing.
Regardless of the timeframe analyzed, Austin currently has a critically low shortage of housing inventory which continues upward pressure on pricing.
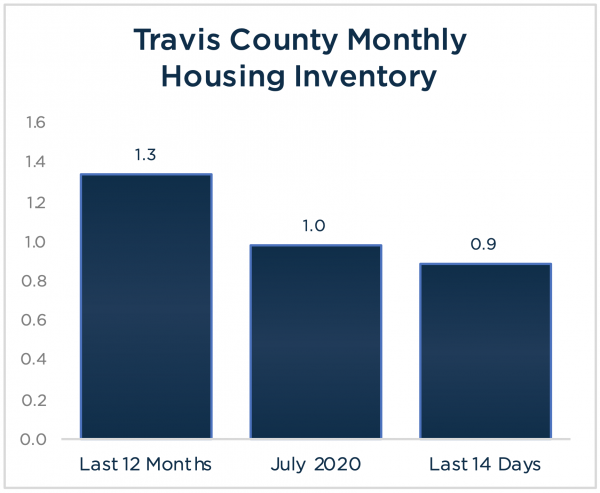
Source: Austin Board of Realtors Travis County, as of August 2nd, 2020, for New and Existing Single Family Homes
Percentage of Sales & Listings by Price Segment
Sales over the past 14 days show more activity for all price segments above $350,000, and less activity below $350,000, as compared to the 12-month average.
The movement toward more sales at higher price points is a reflection of price elasticity in the market based on strong demand and the limited inventory of homes at the lower price points.
As expected, the $250,000 to $350,000 segment remains the largest price segment, representing over 25% and 26.6% of total sales in the 14-day and 12-month timeframes, respectively, followed by $350,000 to $450,000 (22.1%, 20.2%) and $450,000 to $625,000 (18.3%, 18.7%).
Sales are also up for homes from $875,000 to $1,500,000, jumping from 6.7% of total sales over the past year, to 7.7% over the past 14 days, while sales over $1,500,000 have also jumped from 2.8% to 5.2% of total sales.
Although the percentages of sales by price segment are showing movement upward over the last 14 days of July vs. the 12-month average, the price segment distribution among active listings reflects the varying degrees of a housing shortage under $450,000.
For example, the $250,000 to $350,000 segment represented 25% of the sales over the past 14-days while only 15.3% of active listings fall into this category. Even worse, the under $250,000 segment represents 8.1% of all sales over the past 14 days, however only 3.1% of the listing inventory.
Both the shortage of listings at the lower end of the range and greater supply in the upper price segments work together to maintain upward pressure on prices in Travis County.
Source: Austin Board of Realtors Travis County, as of August 2nd, 2020, for New and Existing Single Family Homes
Number of Sales by Price Segment
Pending sales over the past 14 days of all price segments over $250,000 are outpacing their 12-month average. The largest jump of 184% in the $1,500,000+ segment went from a 12-month average of 34 sales a month, to a monthly equivalent run rate of 97 sales based on pending sales from the past 14 days.
The $875,000 to $1,500,000 segment also saw a big increase of 73% based on a 12-month average of 83 sales to a monthly equivalent run rate of 144 sales based on pending sales from the past 14 days.
Source: Austin Board of Realtors Travis County, as of August 2nd, 2020, for New and Existing Single Family Homes
Monthly Housing Inventory by Price Segment
The combination of strong sales and limited active listings across the majority of price segments results in an extremely tight Monthly Housing Inventory. As expected, the $1,500,000+ tier has the largest supply, which currently stands at only a 1.99-month inventory based on the pending sales run rate over the past 14 days. This figure is down from a 5.6-month supply based on the 12-month average number of sales per month, and 3.08-months based on numbers from July. This puts upward pressure on pricing in this upper-end segment of the local market.
 Source: Austin Board of Realtors Travis County, as of August 2nd, 2020, for New and Existing Single Family Homes
Research and analysis included in this report is based on preliminary data from Austin Board of Realtors MLS which is subject to updates for up to three months after data release.
Williamson County Report
Soaring Demand & Dwindling Supply Force Upward Price Elasticity
As a bastion of affordability, sales of affordable homes in the $250,000 to $350,000 price segment represent almost half (46.3%) of the total sales in Williamson County, surging from the 12-month average of 396 sales per month to a current run rate of over 650 sales per month.
While demand soars, the supply of listings for sale in this price range is only 36% of the total available inventory. From another perspective, based on the most recent, pending sales data, there is less than a 1-month housing supply in the $250,000 to $350,000 price segment.
As a result, home buyers increasingly limited choices under $350,000 force demand upward into the higher price segments which, although also suffering from tight inventory, offer comparatively more selection of available homes for sale.
Overall, demand remains very strong across all price points, fueled by historically low interest rates and the Austin MSA’s dynamic economic base, while the anemic housing inventory continues to dwindle.
In spite of potential short-term fluctuations due to COVID-19, mid- and long-term forecasts for strong demand, limited housing supply and price appreciation remain intact.
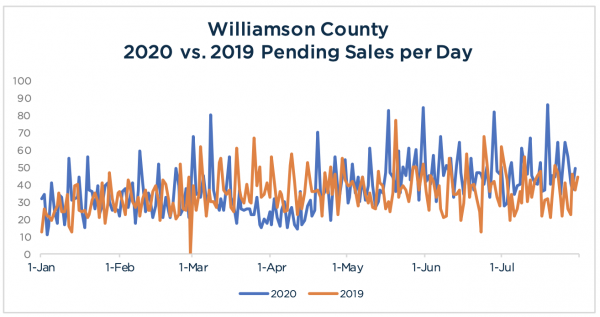
Demand – Pending Sales
Pending sales for July were up 20.4% year-over-year as compared to the same time last year. Both June and May pending sales were also up year-over-year, 34.6% and 19.3%, respectively, after significant drops in March and April due to COVID-19.
With no sign of slowing down, the pace of pending sales over the final 14 days of July is up more than 24% as compared to last year at the same time, which reflects runaway demand that continues to exert upward pressure on pricing.
Source: Austin Board of Realtors Williamson County, as of August 2nd, 2020, for New and Existing Single Family Homes
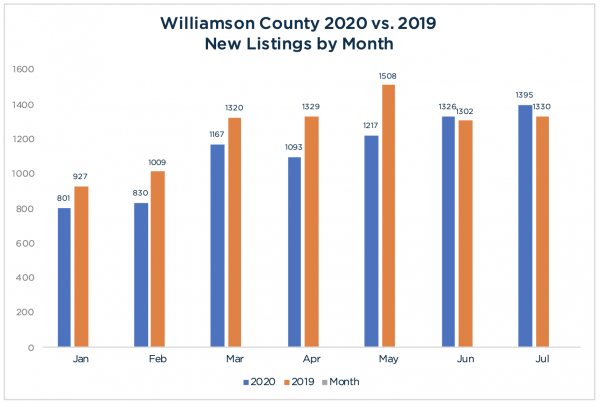
Supply – New Listings
For the first time in 2020, new listings for July exceeded year-over-year numbers from 2019, but not by much. Preliminary statistics show 1,395 new listings in July, a 4.9% increase as compared to July 2019’s figure of 1,330.
Overall, new listings are down 10.27% year-to-date as compared to 2019.
Source: Austin Board of Realtors Williamson County, as of August 2nd, 2020, for New and Existing Single Family Homes
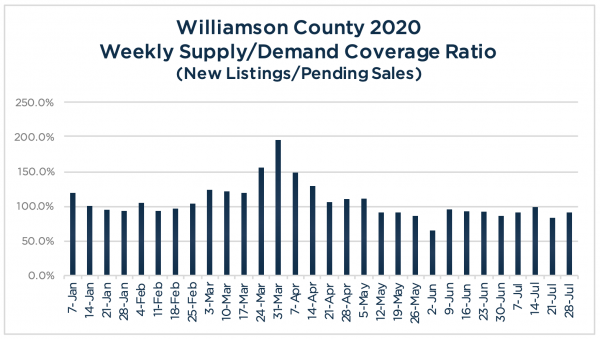
Weekly Supply/Demand Coverage Ratio
Demand (pending sales) has outpaced supply (new listings) for the past twelve consecutive weeks after reversing an eleven week run from mid-February through the end of April which saw more new listings hitting the market per week than pending sales.
Most recent indicators, however, show demand outpacing supply by a significant margin which points to a shrinking inventory of listings for sale.
Source: Austin Board of Realtors Williamson County, as of August 2nd, 2020, for New and Existing Single Family Homes
Maxavenue’s Weekly Supply/Demand Coverage Ratio is calculated by the number of new listings for the week divided by the number of pending sales in the week. 100% indicates no net change in listing inventory. Percentages over 100% indicate a growing inventory of listings for sale while anything lower than 100% reflects a shrinking inventory.
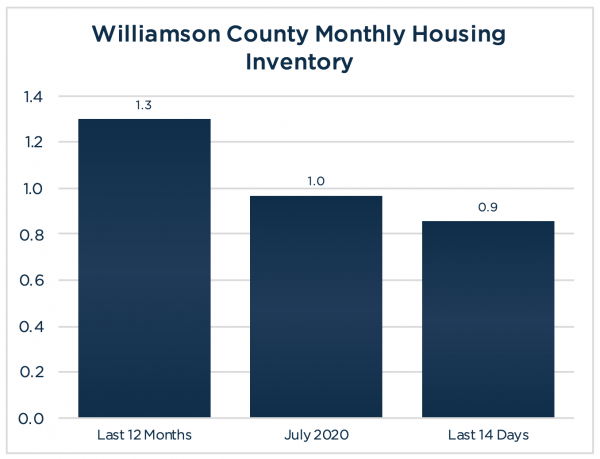
Monthly Housing Inventory
There were 1,265 active listings in Williamson County at the end of July, based on preliminary numbers. Pending sales over the last 14 days of July (extrapolates to 1,472 sales) exceeded the pace set by 12-month average number of sales per month (970 sales). The Absorption Rate indicates a smaller current Monthly Housing Inventory of less than a month (.9) as compared to the 1.3-month inventory based on the 12-month average number of sales per month.
In contrast, using July’s Absorption (1,306 sales) indicates a 1-month supply of housing.
Regardless of the timeframe analyzed, Williamson County currently has a critically low shortage of housing inventory which continues upward pressure on pricing.
Source: Austin Board of Realtors Williamson County, as of August 2nd, 2020, for New and Existing Single Family Homes
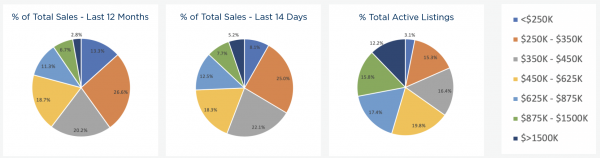
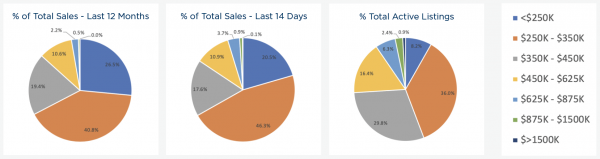
Percentage of Sales & Listings by Price Segment
Sales in the $250,000 to $350,000 price segment continue to represent the largest share of Williamson County’s sales volume at 46.3% of total sales over the last 14 days of July, up from 40.8% of the total over the past 12 months.
Other price segments that experienced significant growth as a percentage of total sales include $625,000 to $875,000 which jumped from 2.2% of the 12-month total to 3.7% over the last 14 days of July. To a lesser degree, the >$1,500,000 segment which grew from .5% to .9% of total sales for the same time periods.
Two segments saw a decline, with <$250,000 dropping from 26.5% of the 12-month total to 20.5% based on the last 14 days of July and $350,000 to $450,000 falling from 19.4% to 17.6% for the same time periods.
While the percentages of sales by price segment are showing movement upward over the last 14 days vs. the 12-month average, the price segment distribution among active listings reflects the housing shortage under $350,000.
For example, the $250,000 to $350,000 segment represents 46.3% of all sales over the past 14 days, however only 36% of the listing inventory falls into this price segment.
In contrast, price segments over $350,000 reflect a greater percentage of the total active listings in comparison to sales.
Both the shortage of listings at the lower end of the range and greater supply in the upper price segments work together to maintain upward pressure on prices in Williamson County.
Source: Austin Board of Realtors Williamson County, as of August 2nd, 2020, for New and Existing Single Family Homes
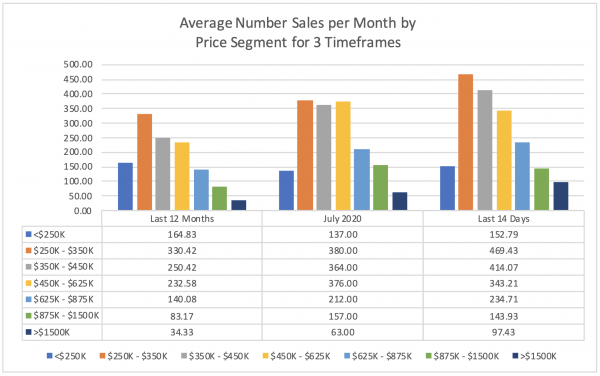
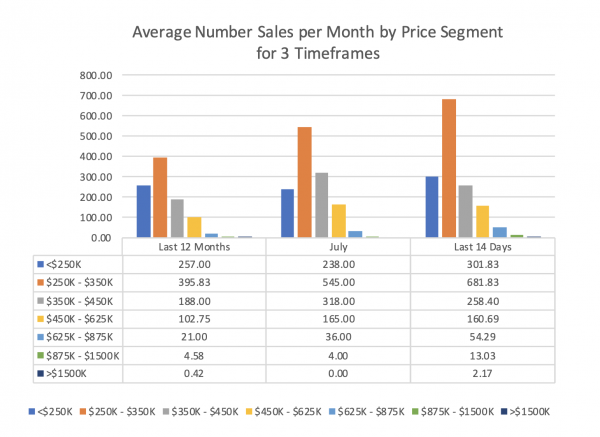
Number of Sales by Price Segment
Pending sales over the past 14 days of all price segments are significantly outpacing their 12-month average. The largest jump of 184.3% in the $875,000 to $1,500,000 price segment increased to a 12-month average of 4.5 sales a month to monthly equivalent run rate of 13 sales based on pending sales from the past 14 days.
The $625,000 to $875,000 price segment also saw a big increase, going from a 12-month average of 21 sales a month, to a monthly equivalent run rate of 54 sales based on pending sales from the past 14 days.
 Source: Austin Board of Realtors Williamson County, as of August 2nd, 2020, for New and Existing Single Family Homes
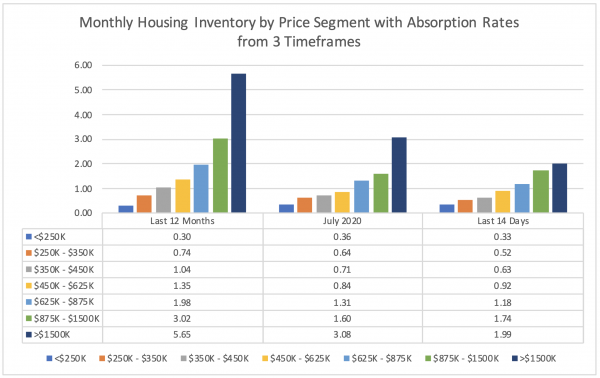
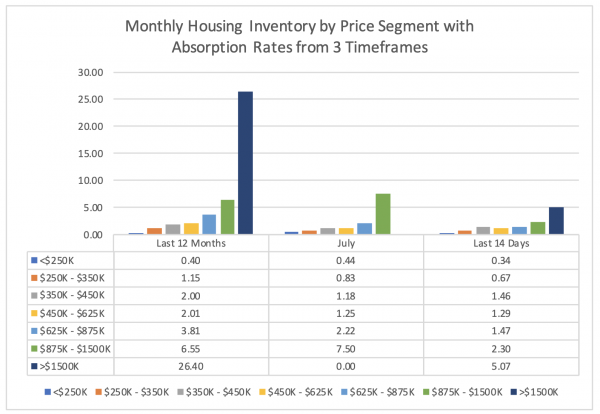
Monthly Housing Inventory by Price Segment
The combination of strong sales and limited active listings across the majority of price segments results in an extremely tight Monthly Housing Inventory until the >$1,500,000 tier.
With the large jump in number of sales per month as compared to the 12-month average, the $875,000 to $1,500,000 segment had the most dramatic drop in Monthly Housing Inventory of 64.8%. The segment went from a 6.55 month supply based on the 12-month average number of sales per month, down to 2.3 months over the past 14-days, which puts upward pressure on pricing in this segment.
The $625,000 to $875,000 segment also saw a significant tightening (61.3%) of available homes for sale, going from a 3.81 month supply based on the 12-month average number of sales per month, down to 1.47% months over the past 14-days.
Demand is strong at the top of the market as well, with a few pending sales over $1,500,000 which cuts the current inventory of 13 listings in this price segment down to 5-month supply.
 Source: Austin Board of Realtors Williamson County, as of August 2nd, 2020, for New and Existing Single Family Homes
Research and analysis included in this report is based on preliminary data from Austin Board of Realtors MLS which is subject to updates for up to three months after data release.


Share this article with your network!