
Austin Real Estate Market Report
Travis County Report
Pending Sales Up – Luxury Home Inventory Down
Latest figures from June reflect acceleration of the trends we saw in May. More pending sales, fewer listings and upward pressure on pricing. Overall, demand remains very strong, fueled by historically low interest rates and Austin’s dynamic economic base, while housing inventory plummets. Particularly at the upper end of the local price range with significant jumps in pending sales above $875,000.
As we begin July, Governor Abbot’s Executive Order on June 26, limiting certain businesses and services as part of the state’s efforts to contain the spread of COVID-19, has created a renewed sense of uncertainty in the market.
Whether or not Austin will see a corresponding drop in demand remains to be seen. Regardless of potential short-term fluctuations, mid- and long-term forecasts for strong demand, limited housing supply and price appreciation remain intact.
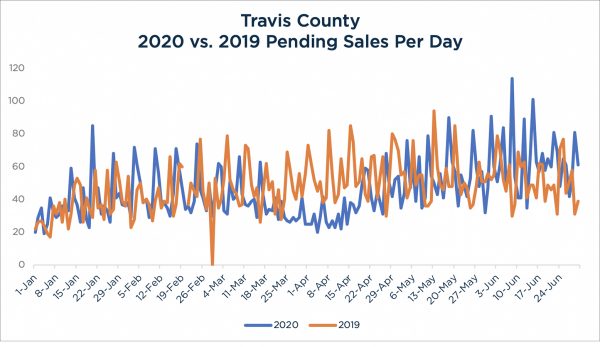
Demand – Pending Sales
Pending sales in June were up 21.4% year-over-year as compared to the same time last year. This rebound continues the turnaround that began in May after bottoming out in April and March, due to COVID-19.
The pace of pending sales over the last 14 days of June was up more than 11% as compared to last year at the same time, which reflects strong demand and maintains upward pressure on pricing.
Overall, pending sales are down 7.5% year-to-date as compared to 2019.
Source: Austin Board of Realtors Travis County, as of July 2nd, 2020, for New and Existing Single Family Homes
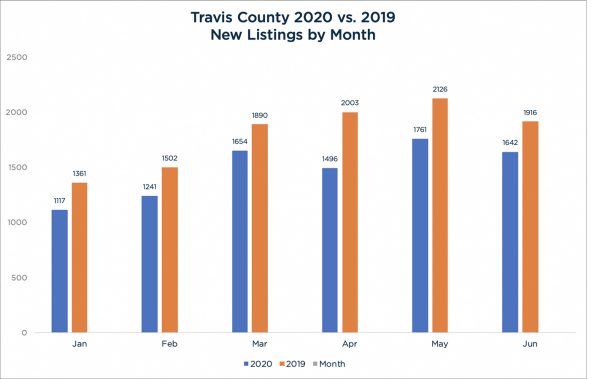
Supply – New Listings
New listings for June fell short of year-over-year numbers from 2019 for the 6th consecutive month, putting increased pressure on an already tight supply of active listings.
Overall, new listings are down 17.5% year-to-date as compared to 2019.
Source: Austin Board of Realtors Travis County, as of July 2nd, 2020, for New and Existing Single Family Homes
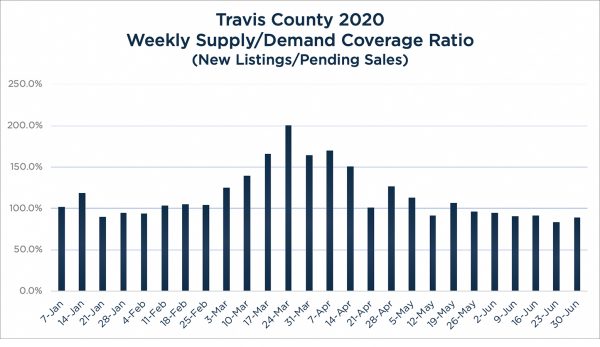
Weekly Supply/Demand Coverage Ratio
Demand (pending sales) consistently outpaced supply (new listings) throughout June, extending the trend to seven out of the past eight weeks, after an extended run of 13 weeks spanning from mid-February through early May when there were more new listings hitting the market per week than pending sales.
Now, in addition to the number of new listings per month remaining below 2019’s year-over-year figures, the actual inventory (total number of active listings) is shrinking again as more homes are selling than being listed on a weekly basis.
Clearly, Travis County housing inventory remains extremely tight, which puts upward pressure on pricing.
Source: Austin Board of Realtors Travis County, as of July 2nd, 2020, for New and Existing Single Family Homes
Maxavenue’s Weekly Supply/Demand Coverage Ratio is calculated by the number of new listings for the week divided by the number of pending sales in the week. 100% indicates no net change in listing inventory. Percentages over 100% indicate a growing inventory of listings for sale while anything lower than 100% reflects a shrinking inventory.
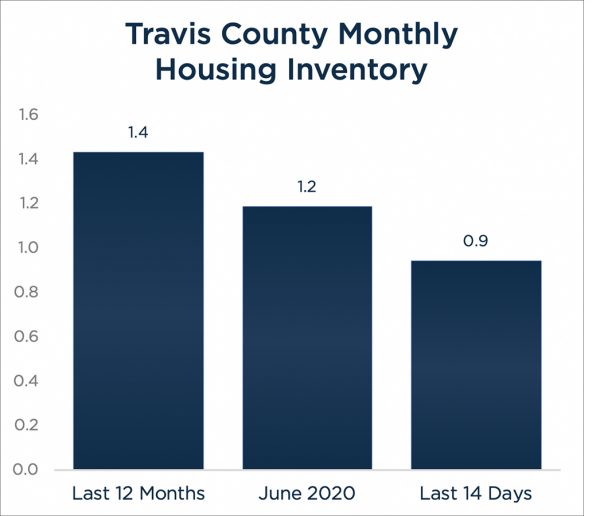
Monthly Housing Inventory
Pending sales over the last 14 days of June (extrapolates to 1,887 sales) exceeded the pace set by 12-month average number of sales per month (1,241 sales), and when used as the Absorption Rate indicates a smaller current Monthly Housing Inventory of less than a month (.9) as compared to the 1.4-month inventory based on the 12-month average number of sales per month.
In contrast, using June’s Absorption (1,498 sales) indicates a 1.2-month supply of housing.
Regardless of the timeframe analyzed, Austin currently has a critically low shortage of housing inventory which continues upward pressure on pricing.
Source: Austin Board of Realtors Travis County, as of July 2nd, 2020, for New and Existing Single Family Homes
Percentage of Sales & Listings by Price Segment
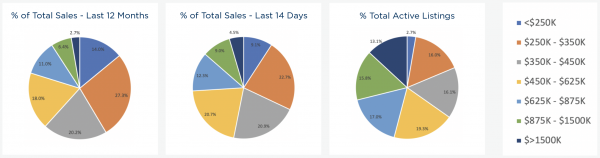
Sales over the past 14 days shows more activity for all price segments above $350,000, and less activity below $350,000, as compared to the 12-month average.
The movement toward more sales at higher price points is a reflection of price elasticity in the market based on strong demand and the limited inventory of homes at the lower price points.
As expected, the $250,000 to $350,000 segment remains the largest price segment, representing over 22.7% and 27.3% of total sales in the 14-day and 12-month timeframes, respectively, followed by $350,000 to $450,000 (20.9%, 20.2%) and $450,000 to $625,000 (20.7%, 18%).
Sales are also up for homes from $875,000 to $1,500,000, jumping from 6.4% of total sales over the past year, to 9% over the past 14 days, while sales over $1,500,000 have also jumped from 2.7% to 4.5% of total sales.
Although the percentages of sales by price segment are showing movement upward over the last 14 days of June vs. the 12-month average, the price segment distribution among active listings reflects the varying degrees of a housing shortage under $450,000.
For example, the $250,000 to $350,000 segment represents 27.3% of all sales over the past 14 days, however only 16% of the listing inventory falls into this price segment. $350,000 to $450,000 segment is similar with 20.9% of sales yet only 16.1% of listings.
The price segment from $450,000 to $625,000 is more in balance with 20.7% of sales and 19.3.% of listings, and then over $625,000, the percentage of listings exceed the percentage of sales.
Both the shortage of listings at the lower end of the range and greater supply in the upper price segments work together to maintain upward pressure on prices in Travis County.
Source: Austin Board of Realtors Travis County, as of July 2nd, 2020, for New and Existing Single Family Homes
Number of Sales by Price Segment
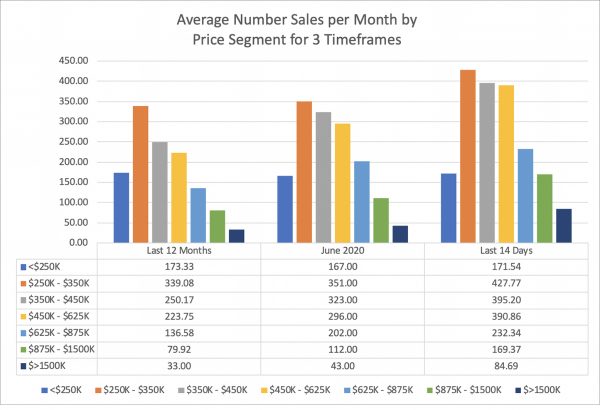
Pending sales over the past 14 days of all price segments over $250,000 are outpacing their 12-month average, with the largest jump of 157% in the $1,500,000+ segment going from a 12-month average of 33 sales a month, to a monthly equivalent run rate of 85 sales based on pending sales from the past 14 days.
The $875,000 to $1,500,000 segment also saw a big increase of 112% based on a 12-month average of 80 sales to a monthly equivalent run rate of 169 sales based on pending sales from the past 14 days.
Source: Austin Board of Realtors Travis County, as of July 2nd, 2020, for New and Existing Single Family Homes
Monthly Housing Inventory by Price Segment
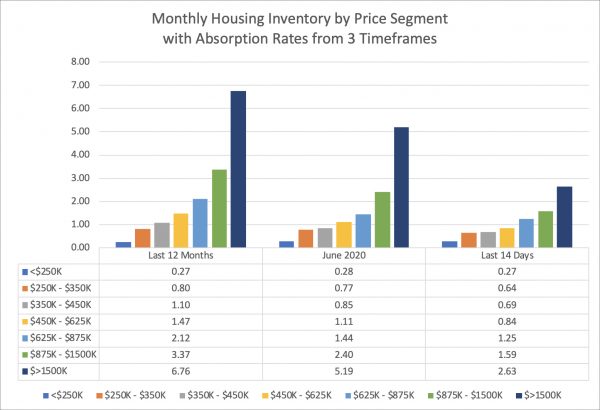
The combination of strong sales and limited active listings across the majority of price segments results in an extremely tight Monthly Housing Inventory. As expected, the $1,500,000+ tier has the largest supply, which currently stands at only a 2.63-month inventory based on the pending sales run rate over the past 14 days. This figure is down from a 6.76-month supply based on the 12-month average number of sales per month, and 5.19-months based on numbers from June, which puts upward pressure on pricing in this upper-end segment of the local market.
Research and analysis included in this report is based on preliminary data from Austin Board of Realtors MLS which is subject to updates for up to three months after data release.
Source: Austin Board of Realtors Travis County, as of July 2nd, 2020, for New and Existing Single Family Homes
Williamson County Report
Relentless Demand & Tight Inventory Pushes Prices Upward
Latest figures from June reflect acceleration of the trends we saw in May, more pending sales, fewer listings and upward pressure on pricing. Overall, demand remains very strong, fueled by historically low interest rates and Williamson County’s dynamic economic base. At the same time, the housing inventory continues to plummet.
As we begin July, Governor Abbot’s Executive Order on June 26, limiting certain businesses and services as part of the state’s efforts to contain the spread of COVID-19, has created a renewed sense of uncertainty in the market. Whether or not Austin will see a corresponding drop in demand remains to be seen. Regardless of potential short-term fluctuations, mid- and long-term forecasts for strong demand, limited housing supply and price appreciation remain intact.
Demand – Pending Sales
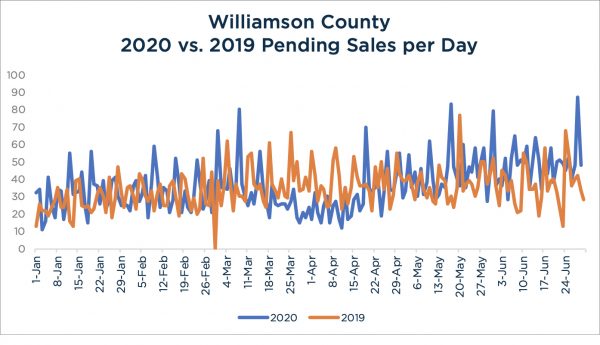
Pending sales for June were up 30.5% year-over-year as compared to the same time last year. Last month, pending sales in May recovered to outpace last year’s levels by a remarkable 19.7% after significant drops in March and April due to COVID-19,
Even more noteworthy, the pace of pending sales over the final 14 days of June is up more than 32% as compared to last year at the same time, which reflects runaway demand that continues to exert upward pressure on pricing.
Source: Austin Board of Realtors Williamson County, as of July 2nd, 2020, for New and Existing Single Family Homes
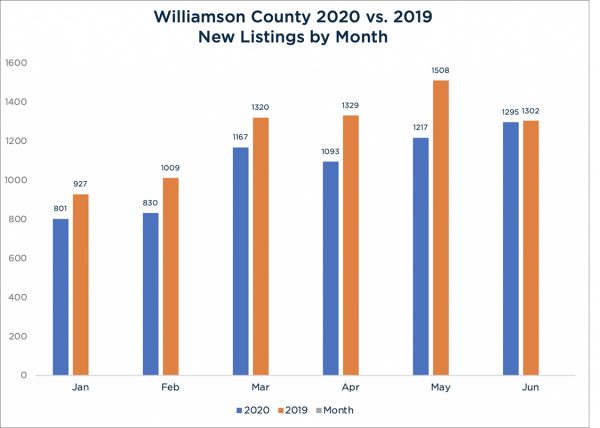
Supply – New Listings
Although up slightly from May, new listings for June fell short of year-over-year numbers from 2019 for the 6th consecutive month, putting increased pressure on an already tight supply of active listings.
Overall, new listings are down 13.4% year-to-date as compared to 2019.
Source: Austin Board of Realtors Williamson County, as of July 2nd, 2020, for New and Existing Single Family Homes
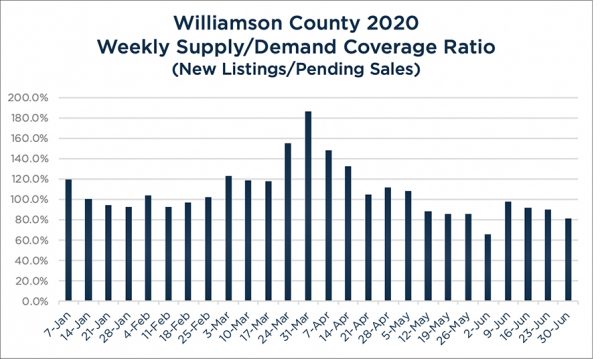
Weekly Supply/Demand Coverage Ratio
Demand (pending sales) has outpaced supply (new listings) for the past eight consecutive weeks after reversing an eleven week run from mid-February through the end of April which saw more new listings hitting the market per week than pending sales.
Most recent indicators, however, show demand outpacing supply by a significant margin which points to a shrinking inventory of listings for sale.
Clearly, Williamson County’s housing inventory remains extremely tight, which puts upward pressure on pricing.
Source: Austin Board of Realtors Williamson County, as of July 2nd, 2020, for New and Existing Single Family Homes
Maxavenue’s Weekly Supply/Demand Coverage Ratio is calculated by the number of new listings for the week divided by the number of pending sales in the week. 100% indicates no net change in listing inventory. Percentages over 100% indicate a growing inventory of listings for sale while anything lower than 100% reflects a shrinking inventory.
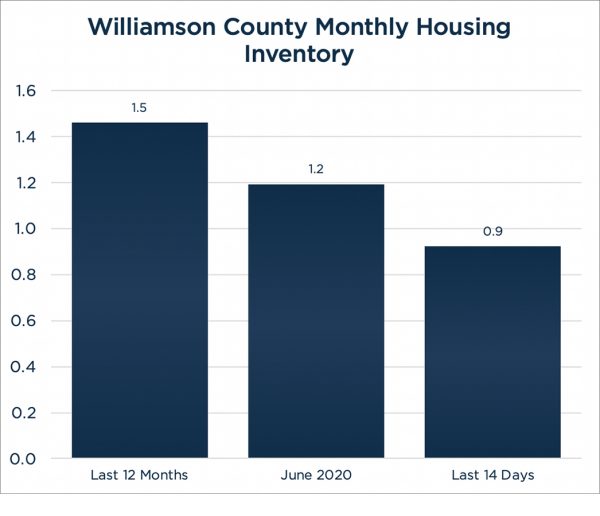
Monthly Housing Inventory
Pending sales over the past 14 days (extrapolates to 1515) has exceeded the 12-month average number of sales per month (959), and when used as the Absorption Rate indicates a smaller current Monthly Housing Inventory of less than a month (.9) as compared to the 1.5-months inventory based on the 12-month average number of sales per month.
In contrast, using June’s Absorption (1172), indicates a 1.2-month supply of housing.
Bottom Line: Regardless of the timeframe used to calculate monthly housing inventory, Williamson County remains a strong seller’s market with an extremely tight housing inventory. Robust sales of single-family homes over the last 14 days bodes well for continued price appreciation as the mid- and long-term impact of COVID-19 continues to unfold.
Source: Austin Board of Realtors Williamson County, as of July 2nd, 2020, for New and Existing Single Family Homes
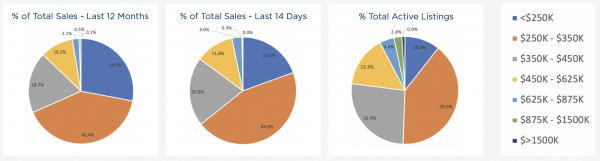
Percentage of Sales & Listings by Price Segment
Sales over the past 14 days shows more activity for all price segments above $250,000, and less activity below $250,000, as compared to the 12-month average.
The movement toward more sales at higher price points is a reflection of price elasticity in the market based on strong demand and the limited inventory of homes.
As expected, the $250,000 to $350,000 segment is the largest, representing apx. 44.8% and 40.4% of the past 14-days and 12-month totals, respectively, followed by $350,000 to $450,000 (20.8%, 18.7%) and $450,000 to $625,000 (11.6%, 10.2%).
Sales as a percentage of the total are up for homes in the $625,000 to $875,000 increasing to 3% over the past 14 days as compared to the 12-month average of 2.1%.
While the percentages of sales by price segment are showing movement upward over the last 14 days vs. the 12-month average, the price segment distribution among active listings reflects the housing shortage under $350,000.
For example, the $250,000 to $350,000 segment represents 44.8% of all sales over the past 14 days, however only 39.9% of the listing inventory falls into this price segment.
In contrast, price segments over $350,000 reflect a greater percentage of the total active listings in comparison to sales.
Both the shortage of listings at the lower end of the range and greater supply in the upper price segments work together to maintain upward pressure on prices in Williamson County.
Source: Austin Board of Realtors Williamson County, as of July 2nd, 2020, for New and Existing Single Family Homes
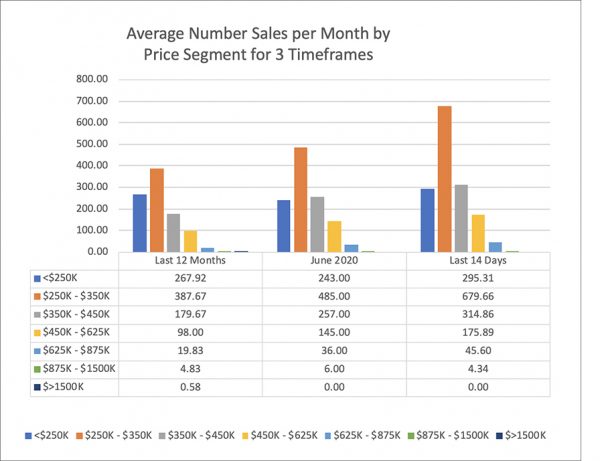
Number of Sales by Price Segment
Pending sales over the past 14 days of all price segments are significantly outpacing their 12-month average, with the largest jump of 129.9% in the $625,000 to $875,000 price segment, going from a 12-month average of 19.83 sales a month, to a monthly equivalent run rate of 45.6 sales based on pending sales from the past 14 days.
The next biggest increase is 79.5% in the $450,000 to $625,000 segment, based on a 12-month average of 98 sales to a monthly equivalent run rate of 175.89 sales based on pending sales from the past 14 days.
These statistics are based on preliminary sales figures from the Austin Board of Realtors.
Source: Austin Board of Realtors Williamson County, as of July 2nd, 2020, for New and Existing Single Family Homes
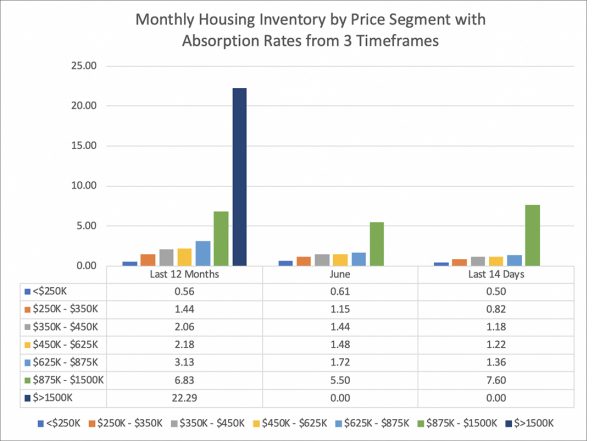
Monthly Housing Inventory by Price Segment
The combination of strong sales and limited active listings across the majority of price segments results in an extremely tight Monthly Housing Inventory until the $875,000 to $1,500,000 tier. The $1,500,000+ upper end price segment currently has 13 active listings, however due to a lack of closed sales in June, or pending sales in the past 14 days to use as an Absorption Rate, it was not possible to calculate a Monthly Housing Inventory for listings over $1,500,000 for those time periods.
With the large jump in number of sales per month as compared to the 12-month average, the $625,000 to $875,000 segment had the most dramatic drop in Monthly Housing Inventory of 56.5%, going from a 3.13 month supply based on the 12-month average number of sales per month, down to 1.36 months over the past 14-days, which puts upward pressure on pricing in this segment.
Source: Austin Board of Realtors Williamson County, as of July 2nd, 2020, for New and Existing Single Family Homes
Research and analysis included in this report is based on preliminary data from Austin Board of Realtors MLS which is subject to updates for up to three months after data release.


Share this article with your network!