
Austin Real Estate Market Report
Travis County Report
Seeking Inventory: Too Few Listings Fuel Price Appreciation
Day-to-day and week-to-week uncertainty amidst the COVID-19 crisis has been replaced with the fact that demand for housing in Travis County remains as strong as ever.
With the reopening of business in Texas, Travis County continues to be a strong seller’s market with a very tight housing inventory, strong demand (pending sales) and upward pressure on pricing.
Year-to-date closed sales data for Travis County indicates a 6.1% annual price appreciation rate as compared to the average sale price from 2019 for the same time period.
Demand – Pending Sales
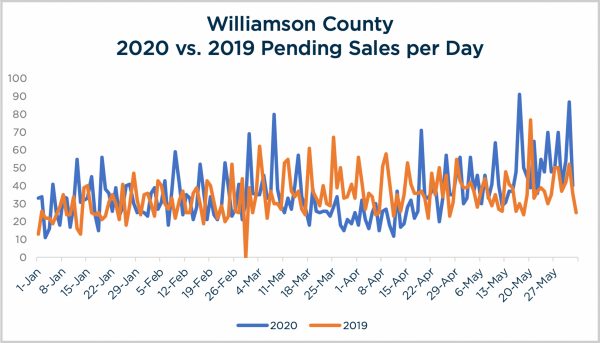
After significant drops in March and April due to COVID-19, pending sales in May recovered to match last year’s levels. Overall, May 2020 pending sales were within a couple tenths of a percentage point vs. May 2019.
The pace of pending sales over the past 14 days is up more than 5% as compared to last year at the same time, which reflects strong demand and maintains upward pressure on pricing.
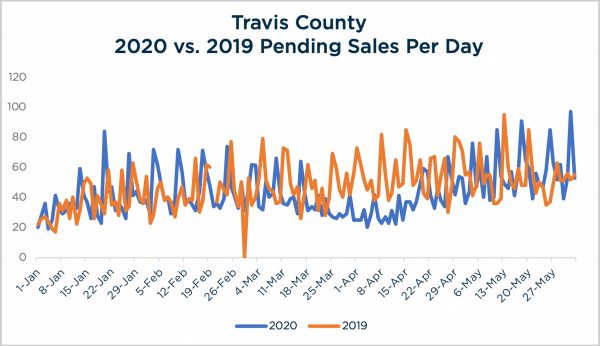
Source: Austin Board of Realtors Travis County, Single-Family Properties, as of June 2nd, 2020
Supply – New Listings
New listings for May are projected to fall short of year-over-year numbers from 2019 for the 5th consecutive month, putting increased pressure on an already tight supply of active listings.
Overall, new listings are down 18.9% year-to-date as compared to 2019.
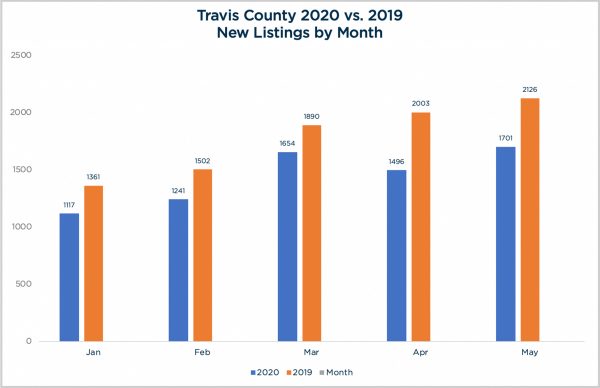
Source: Austin Board of Realtors Travis County, Single-Family Properties, as of June 2nd, 2020
Weekly Supply/Demand Dynamic
Demand (pending sales) have returned to outpace supply (new listings) for three out of the past four weeks, after an extended run of 13 weeks spanning from mid-February through early May when there were more new listings hitting the market per week than pending sales.
Now, in addition to the number of new listings per month remaining below 2019’s year-over-year figures, the actual inventory (total number of active listings) is shrinking again as more homes are selling than being listed on a weekly basis.
Clearly, Travis County housing inventory remains extremely tight, which puts upward pressure on pricing.
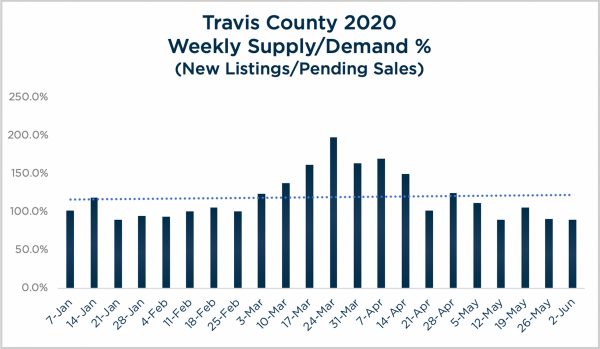
Source: Austin Board of Realtors Travis County, Single-Family Properties, as of June 2nd, 2020
Maxavenue’s Weekly Supply/Demand % is calculated by the number of new listings for the week divided by the number of pending sales in the week. 100% indicates no net change in listing inventory. Percentages over 100% indicate a growing inventory of listings for sale while anything lower than 100% reflects a shrinking inventory.
Monthly Housing Inventory
Pending sales over the past 14 days has exceeded the 12-month average number of sales per month, and when used as the Absorption Rate indicates a smaller current Monthly Housing Inventory of 1.2 months as compared to the 1.6 based on the 12-month average number of sales per month.
In contrast, using May’s Absorption and its drastic drop in sales activity at the height of uncertainty regarding COVID-19, indicates a 2.1-month supply of housing.
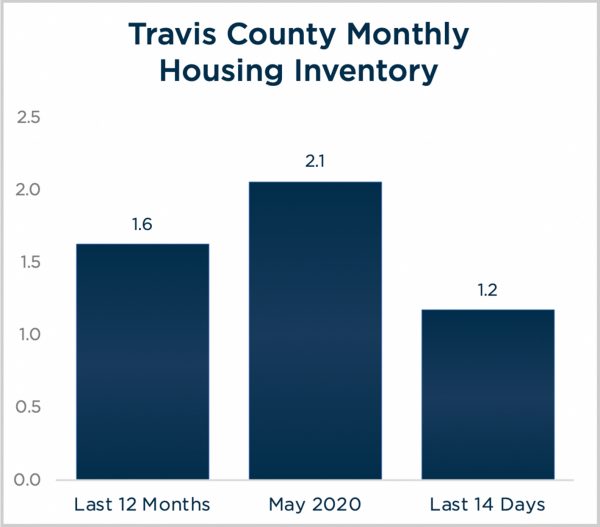
Source: Austin Board of Realtors Travis County, Single-Family Properties, as of June 2nd, 2020
Percentage of Sales & Listings by Price Segment
Sales over the past 14 days shows more activity for all price segments above $350,000, and less activity below $350,000, as compared to the 12-month average.
The movement toward more sales at higher price points is a reflection of price elasticity in the market based on strong demand and the limited inventory of homes at the lower price points.
As expected, the $250,000 to $350,000 segment is the largest, representing over 26% of total sales for both time frames, followed by $350,000 to $450,000 (>20%) and $450,000 to $625,000 (>17.9%).
Sales are also up for homes from $875,000 to $1,500,000, jumping from 6.5% of total sales over the past year, to 8.4% over the past 14 days, while sales over $1,500,000 remain generally stable at between 2.5% and 3% of total sales.
While the percentages of sales by price segment are showing movement upward when the last 14 days vs. the 12-month average, the price segment distribution among active listings reflects the varying degrees of a housing shortage under $450,000.
For example, the $250,000 to $350,000 segment represents 26.5% of all sales over the past 14 days, however only 15.5% of the listing inventory falls into this price segment.
In contrast, price segments over $450,000 reflect a greater percentage of the total active listings in comparison to sales.
Both the shortage of listings at the lower end of the range and greater supply in the upper price segments work together to maintain upward pressure on prices in Travis County
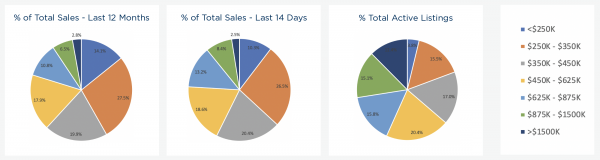
Source: Austin Board of Realtors Travis County, Single-Family Properties, as of June 2nd, 2020
Number of Sales by Price Segment
Pending sales over the past 14 days of all price segments are outpacing their 12-month average, with the largest jump of 79% in the $875,000 to $1,500,000 segment going from a 12-month average of 82.58 sales a month, to a monthly equivalent run rate of 147.66 sales based on pending sales from the past 14 days.
The $625,000 to $875,000 segment also saw a big increase of 69% based on a 12-month average of 137.67 sales to a monthly equivalent run rate of 232.34 sales based on pending sales from the past 14 days.
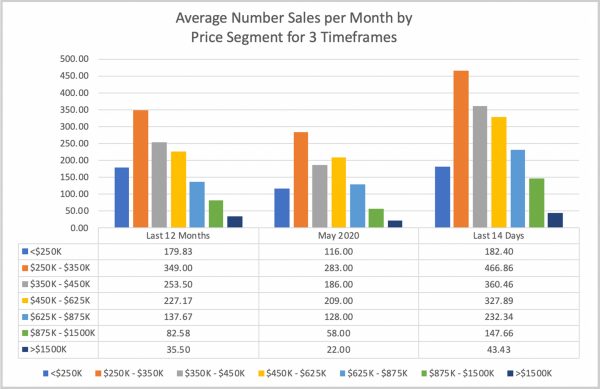
Source: Austin Board of Realtors Travis County, Single-Family Properties, as of June 2nd, 2020
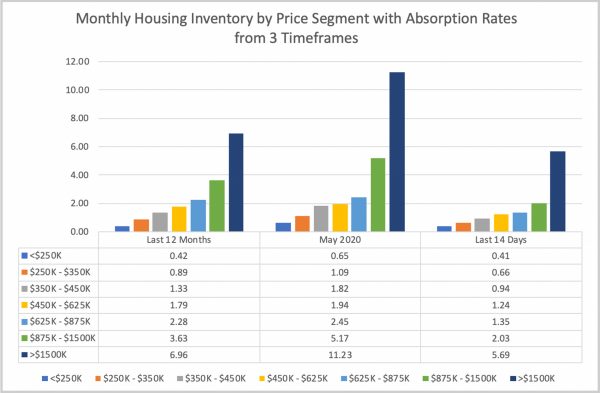
Monthly Housing Inventory by Price Segment
The combination of strong sales and limited active listings across the majority of price segments results in an extremely tight Monthly Housing Inventory. As expected, the $1,500,000+ tier has the largest supply, which currently stands at a 5.7-month inventory based on the pending sales run rate over the past 14 days. This figure is down from a 6.96-month supply based on the 12-month average number of sales per month, and 11.23-months based on numbers from May, which reflect the peak of COVID-19’s impact on the market.
With the large jump in number of sales per month as compared to the 12-month average, the $875,000 to $1,500,000 segment had the most dramatic drop in Monthly Housing Inventory of 44%, going from a 3.63 month supply based on the 12-month average number of sales per month, down to 2.03 months over the past 14-days, which puts upward pressure on pricing in this segment.
Research and analysis included in this report is based on preliminary data from Austin Board of Realtors MLS which is subject to updates for up to three months after data release.
Source: Austin Board of Realtors Travis County, Single-Family Properties, as of June 2nd, 2020
Williamson County Report
Runaway Demand: Prices Have to Nowhere to Go but Up
With the reopening of business in Texas, Williamson County continues to be a strong seller’s market with a very tight housing inventory, strong demand (pending sales) and upward pressure on pricing.
Pending sales activity over the past 14 days have been moving at a torrid pace, which would translate to an overall 1-month Housing Inventory for Williamson County if that pace is sustained over the next few weeks.
Year-to-date closed sales data for Williamson County indicates a 5.3% annual price appreciation rate as compared to the average sale price from 2019 for the same time period. It is anticipated that the appreciation rate will accelerate in the 3rd and 4th quarters as current pending sales begin close at higher price points.
Demand – Pending Sales
After significant drops in March and April due to COVID-19, pending sales in May recovered to outpace last year’s levels by a remarkable 19.7%, based on preliminary figures from Austin Board of Realtors.
Even more noteworthy, the pace of pending sales over the past 14 days is up more than 33% as compared to last year at the same time, which reflects runaway demand that continues to exert upward pressure on pricing.
Source: Austin Board of Realtors Williamson County, Single-Family Properties, as of June 2nd, 2020
Supply – New Listings
New listings for May are projected to fall short of year-over-year numbers from 2019 for the 5th consecutive month, putting increased pressure on an already tight supply of active listings.
Overall, new listings are down 16.5% year-to-date as compared to 2019.
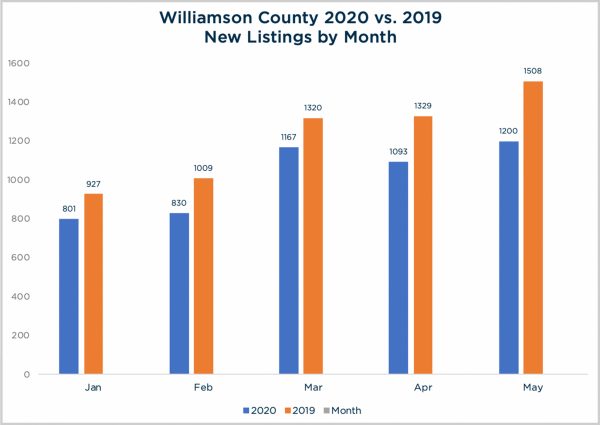
Source: Austin Board of Realtors Williamson County, Single-Family Properties, as of June 2nd, 2020
Weekly Supply/Demand Dynamic
Demand (pending sales) has outpaced supply (new listings) for the past four weeks, reversing an eleven week run from mid-February through the end of April which saw more new listings hitting the market per week than pending sales.
Even though the number of listings per month are below 2019’s year-over-year figures, as a result of the eleven week run of supply exceeding demand, the actual inventory (total number of active listings) grew in March and April because more new listings were hitting the market per week than pending sales.
Most recent indicators, however, show demand outpacing supply by a significant margin which points to a shrinking inventory of listings for sale.
Clearly, Williamson County’s housing inventory remains extremely tight, which puts upward pressure on pricing.
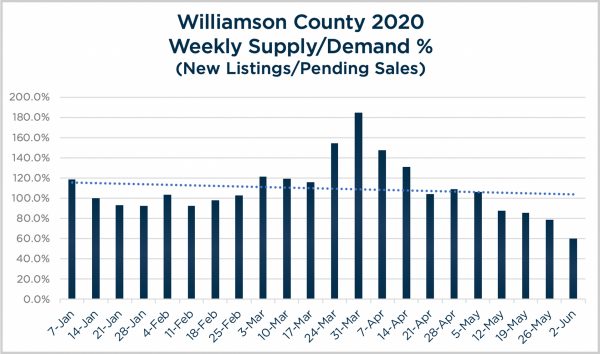
Source: Austin Board of Realtors Williamson County, Single-Family Properties, as of June 2nd, 2020
Maxavenue’s Weekly Supply/Demand % is calculated by the number of new listings for the week divided by the number of pending sales in the week. 100% indicates no net change in listing inventory. Percentages over 100% indicate a growing inventory of listings for sale while anything lower than 100% reflects a shrinking inventory.
Monthly Housing Inventory
Pending sales over the past 14 days has exceeded the 12-month average number of sales per month, and when used as the Absorption Rate indicates a smaller current Monthly Housing Inventory of 1.0 months as compared to the 1.7 based on the 12-month average number of sales per month.
In contrast, using May’s Absorption and its drastic drop in sales activity at the height of uncertainty regarding COVID-19, indicates a 2.1-month supply of housing.
Bottom Line: Regardless of the timeframe used to calculate monthly housing inventory, Williamson County remains a strong seller’s market with an extremely tight housing inventory. Robust sales of single-family homes over the last 14 days bodes well for continued price appreciation as the mid- and long-term impact of COVID-19 continues to unfold.
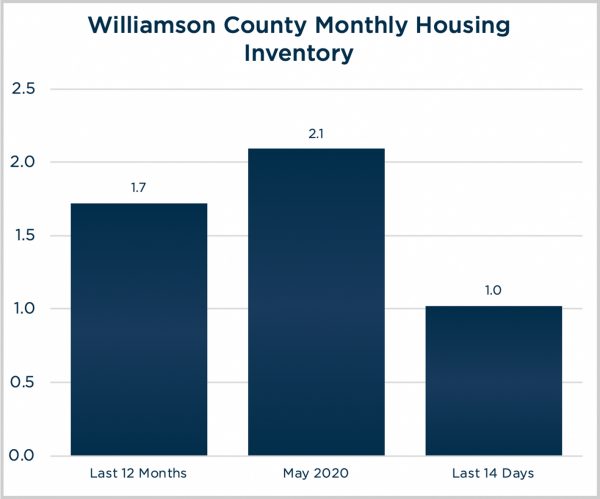
Source: Austin Board of Realtors Williamson County, Single-Family Properties, as of June 2nd, 2020
Percentage of Sales & Listings by Price Segment
Sales over the past 14 days shows more activity for all price segments above $250,000, and less activity below $250,000, as compared to the 12-month average.
The movement toward more sales at higher price points is a reflection of price elasticity in the market based on strong demand and the limited inventory of homes.
As expected, the $250,000 to $350,000 segment is the largest, representing apx. 40% or more of total sales for both time frames, followed by $350,000 to $450,000 (19%) and $450,000 to $625,000 (>10%).
Sales as a percentage of the total are generally stable also for homes in the $625,000 to $875,000 increasing to 3.5% over the past 14 days as compared to the 12-month average of 2%.
While the percentages of sales by price segment are showing movement upward when the last 14 days vs. the 12-month average, the price segment distribution among active listings reflects the housing shortage under $350,000.
For example, the $250,000 to $350,000 segment represents 45.1% of all sales over the past 14 days, however only 41.8% of the listing inventory falls into this price segment.
In contrast, price segments over $350,000 reflect a greater percentage of the total active listings in comparison to sales.
Both the shortage of listings at the lower end of the range and greater supply in the upper price segments work together to maintain upward pressure on prices in Williamson County.
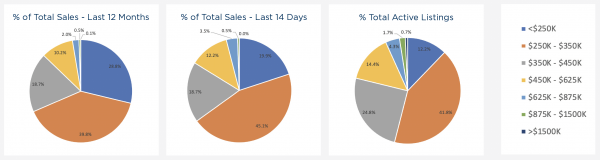
Source: Austin Board of Realtors Williamson County, Single-Family Properties, as of June 2nd, 2020
Number of Sales by Price Segment
Pending sales over the past 14 days of all price segments are significantly outpacing their 12-month average, with the largest jump of 191% in the $625,000 to $875,000 price segment, going from a 12-month average of 19.42 sales a month, to a monthly equivalent run rate of 56.46 sales based on pending sales from the past 14 days.
The next biggest increase is 101.8% in the $450,000 to $625,000 segment, based on a 12-month average of 97.92 sales to a monthly equivalent run rate of 197.6 sales based on pending sales from the past 14 days.
These statistics are based on preliminary sales figures from the Austin Board of Realtors.
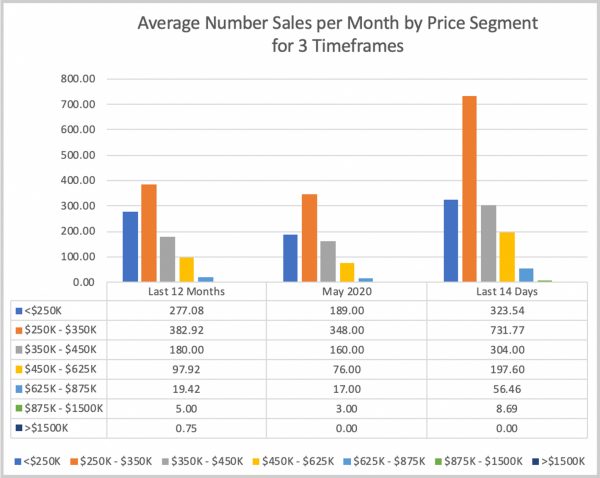
Source: Austin Board of Realtors Williamson County, Single-Family Properties, as of June 2nd, 2020
Monthly Housing Inventory by Price Segment
The combination of strong sales and limited active listings across the majority of price segments results in an extremely tight Monthly Housing Inventory until the $1,500,000+ tier. The upper end price segment currently has 12 active listings, however due to a lack of closed sales in May, or pending sales in the past 14 days to use as an Absorption Rate, it was not possible to calculate a Monthly Housing Inventory for listings over $1,500,000.
With the large jump in number of sales per month as compared to the 12-month average, the $625,000 to $875,000 segment had the most dramatic drop in Monthly Housing Inventory of 65.6%, going from a 3.66 month supply based on the 12-month average number of sales per month, down to 1.26 months over the past 14-days, which puts upward pressure on pricing in this segment.
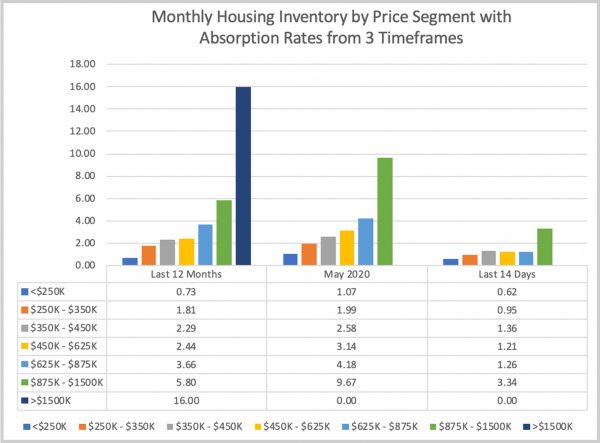
Source: Austin Board of Realtors Williamson County, Single-Family Properties, as of June 2nd, 2020
Research and analysis included in this report is based on preliminary data from Austin Board of Realtors MLS which is subject to updates for up to three months after data release


Share this article with your network!