
Austin Real Estate Market Report
Uncertainty Transitions into Optimism
Travis County Report
Representing over 60% of the Austin MSA’s gross sales volume (dollars), Travis County is a clear example of the local housing market’s strength and resiliency.
Leading into March, Travis County’s already anemic housing inventory continued to tighten, with new listings of single family homes down 17.9% in January and 17.4% in February as compared to 2019. Meanwhile, pending sales showed an increase year-over-year of 4.1% and 6.7% respectively.
The first two weeks in March showed early signs of a slowdown, with pending sales dropping below last year’s figures by 9.8% and 17.9% respectively vs. the same time last year.
Then in the week following the declaration of a National Emergency, pending sales dropped 21.4% year-over-year followed by a three-week free fall of 42.5%, 44.3% and 47.2% drops year-over-year, respectively.
Market Rebounds in Mid-April
The six-week run of increasingly worse sales figures gave us more than a month of massive uncertainty with speculation that the economy was headed into not just a recession, but a depression, the likes of which haven’t been seen in over 80 years.
However, beginning mid-April, there was a dramatic turnaround with pending sales jumping to a much improved 20.7% drop year-over-year, followed by the final full week of April, which rose to within 9.1% of 2019’s sales figures!
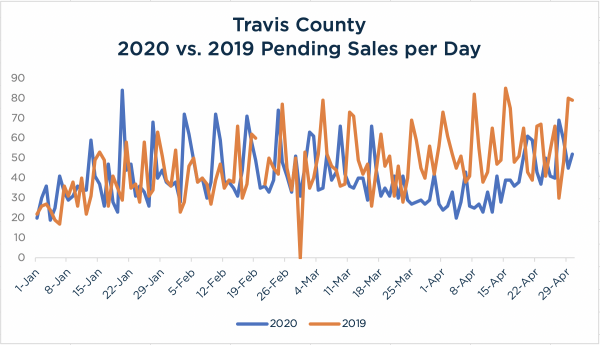
Source: Austin Board of Realtors Travis County, Single-Family Properties, as of April 30th, 2020
New Listings per Month
Travis County’s year-over-year numbers for new listings of single family homes per month is down for every month of 2020 as compared to 2019. April had 1,431 new listings as compared to 2,003 for April 2019, a 28.6% drop year-over-year.
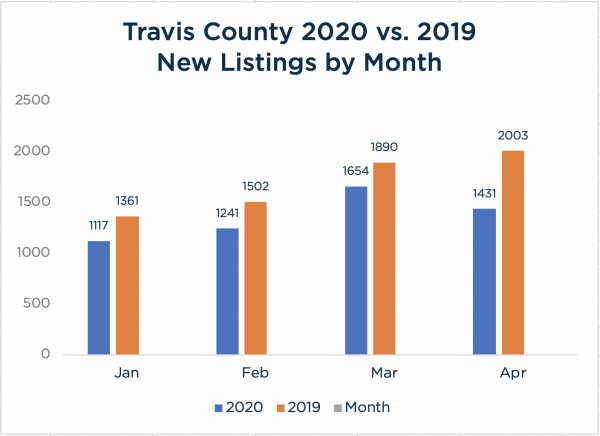
Source: Austin Board of Realtors Travis County, Single-Family Properties, as of April 30th, 2020
Market Direction
2020 began with a very strong Seller’s market and more pending sales per week than new listings to drive a steadily shrinking housing inventory for the first 8 weeks, or two months of the year.
However, in the last few days of February the COVID-19’s impact on the market began to emerge. Both new listings and pending sales were down year-over-year, but pending sales were hit harder and the trend started to shift toward more new listings than pending sales per week for a stretch of seven weeks that ended in the middle of April.
As a result, for the first time in a long time, Travis County saw a growing inventory of listings and change in direction toward a balanced market from February through mid-April.
Then, the final two weeks of April saw a big uptick in pending sales of single family homes that hovered just slightly above or below the number of new listings, which nets out to no significant directional movement at the end of the month.
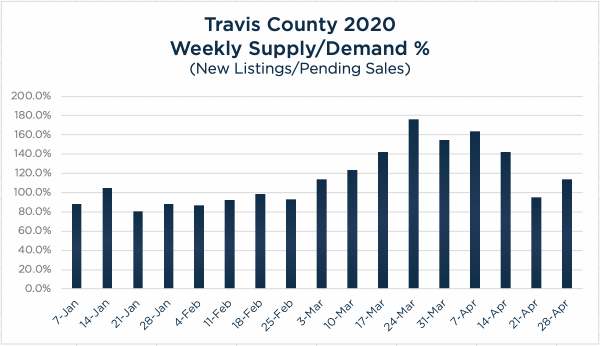
Source: Austin Board of Realtors Travis County, Single-Family Properties, as of April 30th, 2020
Maxavenue’s Weekly Supply/Demand % is calculated by the number of new listings for the week divided by the number of pending sales in the week. 100% indicates no net change in listing inventory. Percentages over 100% indicate a growing inventory of listings for sale while anything lower than 100% reflects a shrinking inventory.
Monthly Housing Inventory
Going into May, Travis County’s monthly housing inventory ranges between a 1.5 to 2.3-month range depending on the absorption rate’s underlying timeframe assumption.
In context of COVID-19, the average number of sales per month for the past 12 months will not reflect current market conditions, so we’ve also looked at the actual number of closed sales in April, and also pending sales over the past 14 days to best interpret current market dynamics.
Travis County’s pending sales were very strong for the 14-day period at the end of April, which outpaced the 12-month average, as well as April’s average which was dragged down by the month’s slow start.
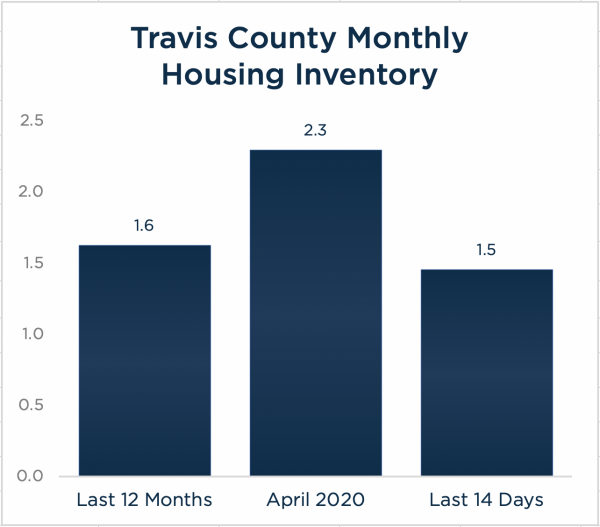
Source: Austin Board of Realtors Travis County, Single-Family Properties, as of April 30th, 2020
Monthly Housing Inventory* calculations based on 2,153 active listings on April 30th, 2020 and absorption rates (number of sales per month) from three timeframes:
- – 12-month Closed Sales Average: 1.6-month inventory based on 1,324 sales per month
- – April 2020 Closed Sales: 2.3-month inventory based on 937 number of closed sales for April 2020
- – Last 14 Days Pending Sales: 1.5-month inventory based on a forecast of 1,479 sales per month – projection extrapolated to a full month equivalent from last 14 days pending sales
(*) Monthly Housing Inventory is calculated by dividing the number of Active Listings by the Absorption Rate (number of Sales per month).
Regardless of the timeframe used to calculate monthly housing inventory, Travis County remains a strong seller’s market. Robust sales of single family homes over the last 14 days of April bodes well for continued price appreciation as the short-, mid- and long-term impact of COVID-19 continues to unfold.
Williamson County Report
Representing apx. 30% of the Austin MSA’s gross sales volume (dollars), Williamson County is another impressive example of the local housing market’s strength and resiliency.
Leading into March, Williamson County saw fewer new listings of single family homes as compared to last year, down 13.6% in January and 17.7% in February as compared to 2019, while pending sales increased year-over-year by 13.5% and 9.2% respectively.
The first week in March remained strong with pending sales 24.2% above last year’s figures, however as COVID-19’s impact was beginning to emerge, pending sales in the next week dropped to 6.8% below last year’s mark.
Then after the declaration of a National Emergency, Williamson County had four weeks in a row of year-over-year declining sales, down 27.8%, 45.5%, 30% and 41.9% as compared to last year.
As we saw in Travis County, there was a huge jump in the third week of April with pending sales in Williamson County springing back to just under 3.1% of last year, followed by an even stronger week to close out April with pending sales once again over 2019’s numbers, up 3.8% year-over-year.
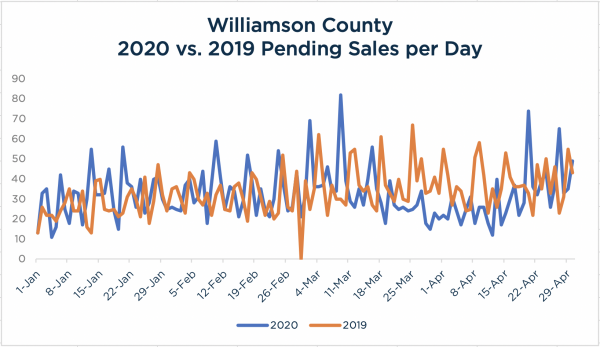
Source: Austin Board of Realtors Williamson County, Single-Family Properties, as of April 30th, 2020
New Listings per Month
Williamson County’s year-over-year numbers for new listings of single family homes per month are down for all four months of 2020 and April had 1,065 new listings as compared to 1,329 for April 2019, a 19.9% drop year-over-year.
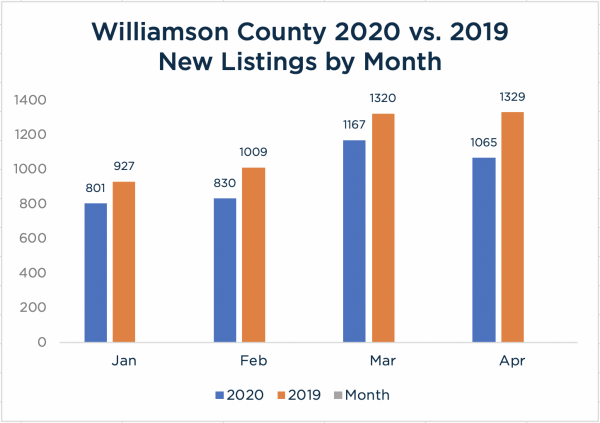
Source: Austin Board of Realtors Williamson County, Single-Family Properties, as of April 30th, 2020
Market Direction
Back in January Williamson County began the year with a very strong Sellers market and more pending sales per week than new listings for seven of 2020’s first eight weeks.
However, in the last few days of February the COVID-19’s impact on the market began to emerge. Both new listings and pending sales were down year-over-year, but pending sales were hit harder and the trend started to shift toward more new listings than pending sales per week for eight of the next nine weeks ending in the last week of April.
As a result, Williamson County saw a growing inventory of listings and change in direction toward a balanced market in March through mid-April.
Then, the final two weeks of April saw a big uptick in pending sales that hovered just slightly above or below the number of new listings, which nets out to no significant directional movement at the end of the month.
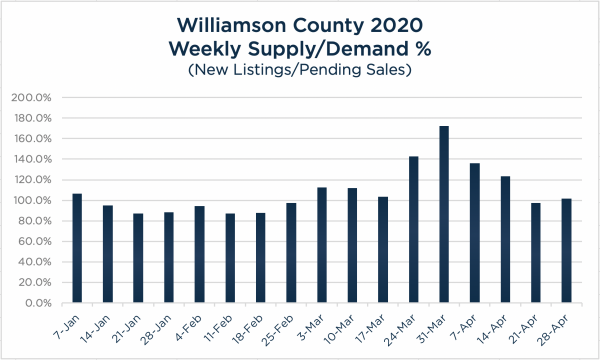
Source: Austin Board of Realtors Williamson County, Single-Family Properties, as of April 30th, 2020
Maxavenue’s Weekly Supply/Demand % is calculated by the number of new listings for the week divided by the number of pending sales in the week. 100% indicates no net change in listing inventory. Percentages over 100% indicate a growing inventory of listings for sale while anything lower than 100% reflects a shrinking inventory.
Monthly Housing Inventory
Going into May, Williamson County’s Monthly Housing Inventory ranges between a 1.6 to 2.6-month supply depending on the absorption rate’s underlying timeframe assumption.
In context of COVID-19, the average number of sales per month for the past 12 months will not reflect current market conditions, so we’ve also looked at the actual number of closed sales in April, and also pending sales over the past 14 days to best interpret current market dynamics.
Williamson County’s pending sales were very strong for the 14-day period at the end of April, which outpaced the 12-month average, as well as April’s average which was dragged down by the month’s slow start.
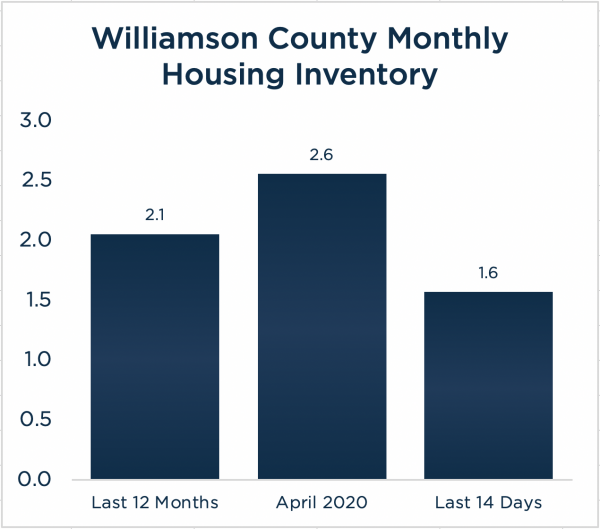
Source: Austin Board of Realtors Williamson County, Single-Family Properties, as of April 30th, 2020
Monthly Housing Inventory* calculations based on 1,896 active listings on April 30th, 2020 and absorption rates (number of sales per month) from three timeframes:
- – 12-month Closed Sales Average: 2.1-month inventory based on 922 sales per month
- – April 2020 Closed Sales: 2.6-month inventory based on 742 number of closed sales for April 2020
- – Last 14 Days Pending Sales: 1.6-month inventory based on a forecast of 1,207 sales per month – projection extrapolated to a full month equivalent from last 14 days pending sales
(*) Monthly Housing Inventory is calculated by dividing the number of Active Listings by the Absorption Rate (number of Sales per month).
Regardless of the timeframe used to calculate monthly housing inventory, Williamson County remains a strong seller’s market. Robust sales of single family homes over the last 14 days of April bodes well for continued price appreciation as the short-, mid- and long-term impact of COVID-19 continues to unfold.


Share this article with your network!